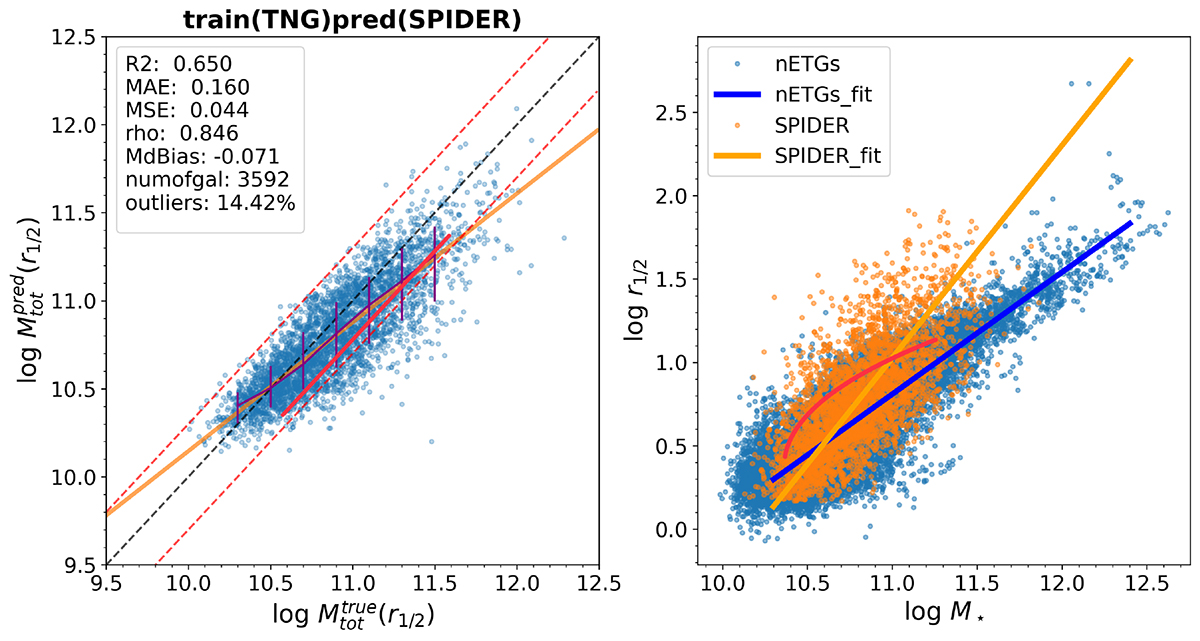
Fig. 13.
Download original image
MELA_ALL prediction and the scaling relation analysis of SPIDER. Left panel: result of applying MELA_ALL on SPIDER with four features (g, r, M⋆, σ) and missing the r1/2. The green circle is the median value for a given x-axis bin, where the bin size is 0.1 dex. The orange line represents the linear fit of the blue data points. Right panel: M⋆-r1/2 relation of nETGs and SPIDER. A linear fit line is displayed for both data points. The best linear fit of the SPIDER sample is determined by averaging the linear fit using log M⋆ and log r1/2 as independent variables. This approach compensates for the more unbalanced distribution observed towards log M⋆/M⊙ ≲ 11.2. Completeness effects on the M⋆-r1/2 relation are not considered here, as the focus is on understanding the origin of the tilt in the predictions (left panel).
Current usage metrics show cumulative count of Article Views (full-text article views including HTML views, PDF and ePub downloads, according to the available data) and Abstracts Views on Vision4Press platform.
Data correspond to usage on the plateform after 2015. The current usage metrics is available 48-96 hours after online publication and is updated daily on week days.
Initial download of the metrics may take a while.