Fig. 1.
Download original image
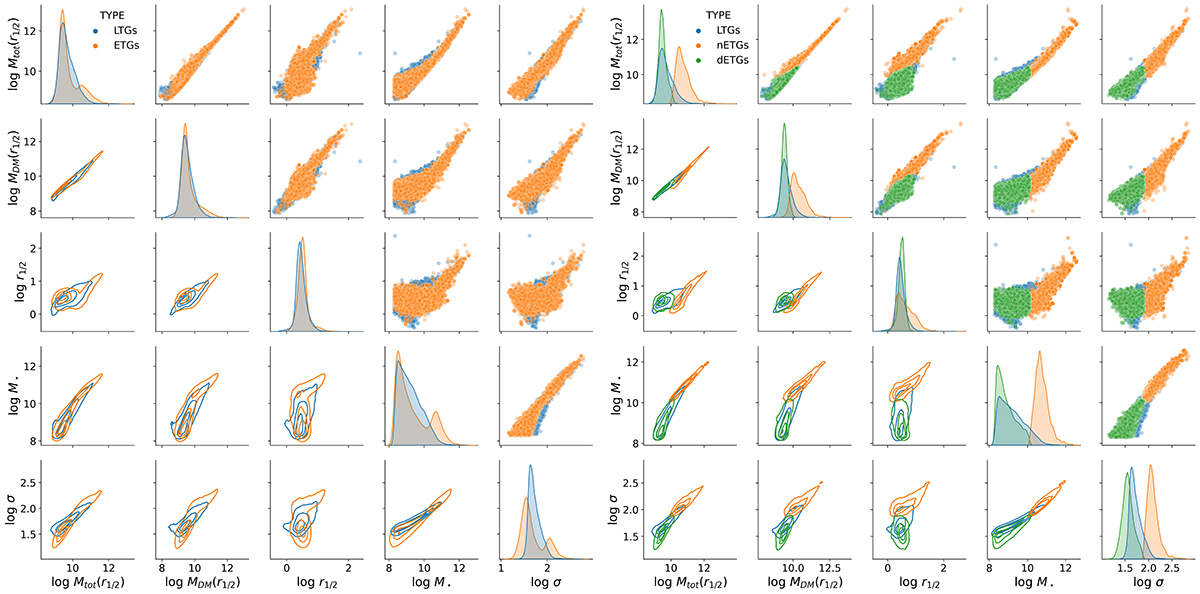
Distribution of relevant features and targets as in Table 1: total mass inside the stellar half-mass radius, augmented dark matter mass inside stellar half-mass radius, half-mass radius, stellar mass in half-mass radius, velocity dispersion, total and dark matter mass in half-light radius. Left: galaxies are divided into ETGs and LTGs on the basis of their SFR. Right: ETGs are further divided into normal and dwarf ETGs based on the classification criteria outlined in Table 2. The normalized distribution of the features and targets is shown along the diagonal. Units are as in Table 1. This is the original data from TNG100 without considering mock measurement errors. To get a comparative picture, a fixed value was set for the different types of galaxies. We randomly get a 20 000 galaxy subsample from the full dataset and from the three galaxy types.
Current usage metrics show cumulative count of Article Views (full-text article views including HTML views, PDF and ePub downloads, according to the available data) and Abstracts Views on Vision4Press platform.
Data correspond to usage on the plateform after 2015. The current usage metrics is available 48-96 hours after online publication and is updated daily on week days.
Initial download of the metrics may take a while.