Fig. 7.
Download original image
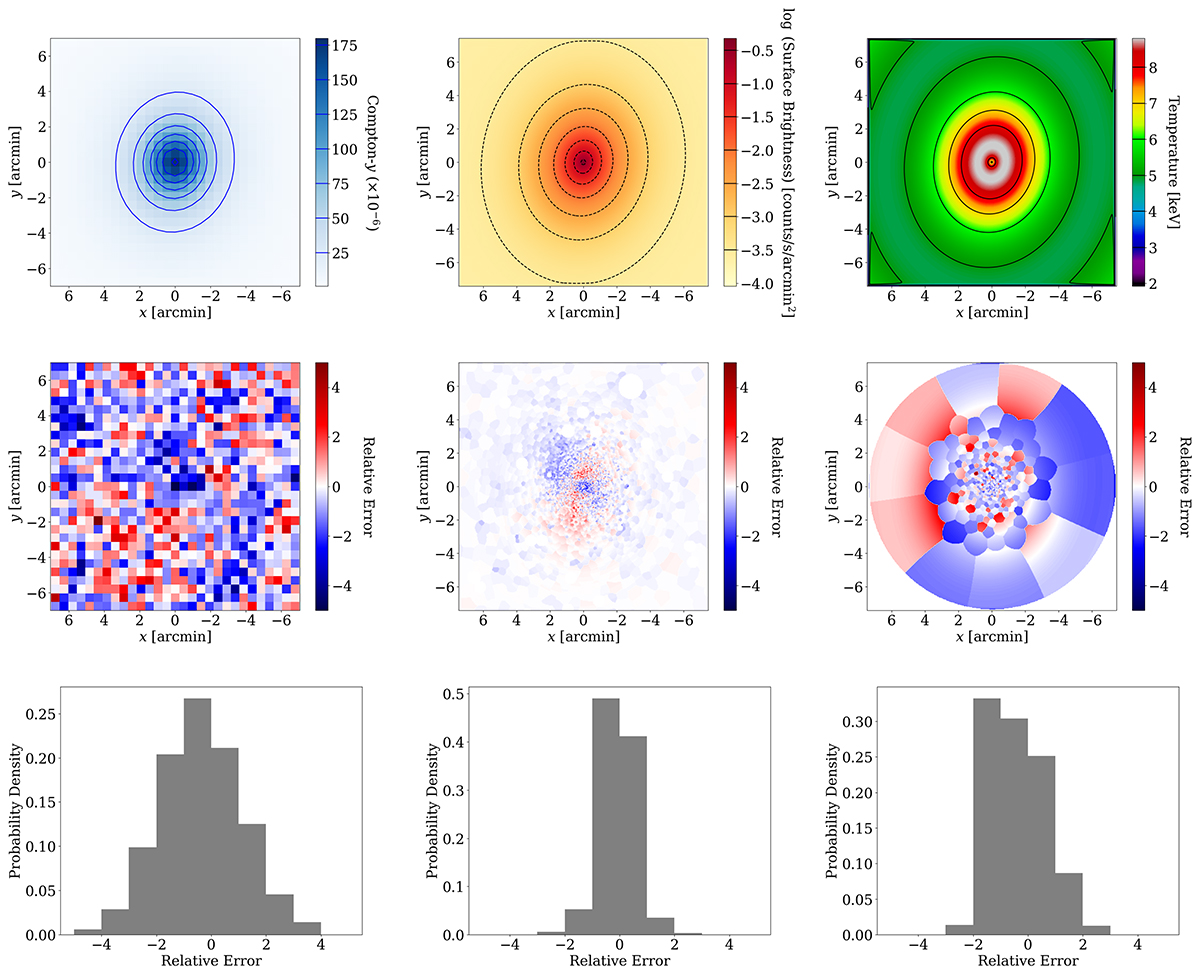
Reconstructed SZ and X-ray models of PSZ2 G313.33+61.13 generated using the recovered parameters from Fig. 6 (top). The difference between the observational data and the reconstructed model map above, in units of pixel-based error (middle). The histogram of the distribution of the relative error in the middle panels (bottom). The X-ray SB histogram takes into account both the residuals in the inner two-dimensional region, which includes 80% of the emissions observed in the data, and the outer map region where we implemented one-dimensional analysis using azimuthal medians (see Fig. 5). In all cases, the residuals are distributed within ±4σ level compared to the error. When the relative errors of the SZ, X-ray SB, and X-ray temperature are modeled with a Gaussian fit, their standard deviations align with 1.5σ, 0.6σ, and 1.1σ respectively. Comparatively, 63.8%, 64.4%, and 100% of the data from SZ, X-ray SB, and X-ray temperature maps respectively exhibit pixel-based signal-to-noise ratios exceeding 1.5.
Current usage metrics show cumulative count of Article Views (full-text article views including HTML views, PDF and ePub downloads, according to the available data) and Abstracts Views on Vision4Press platform.
Data correspond to usage on the plateform after 2015. The current usage metrics is available 48-96 hours after online publication and is updated daily on week days.
Initial download of the metrics may take a while.