Fig. 6.
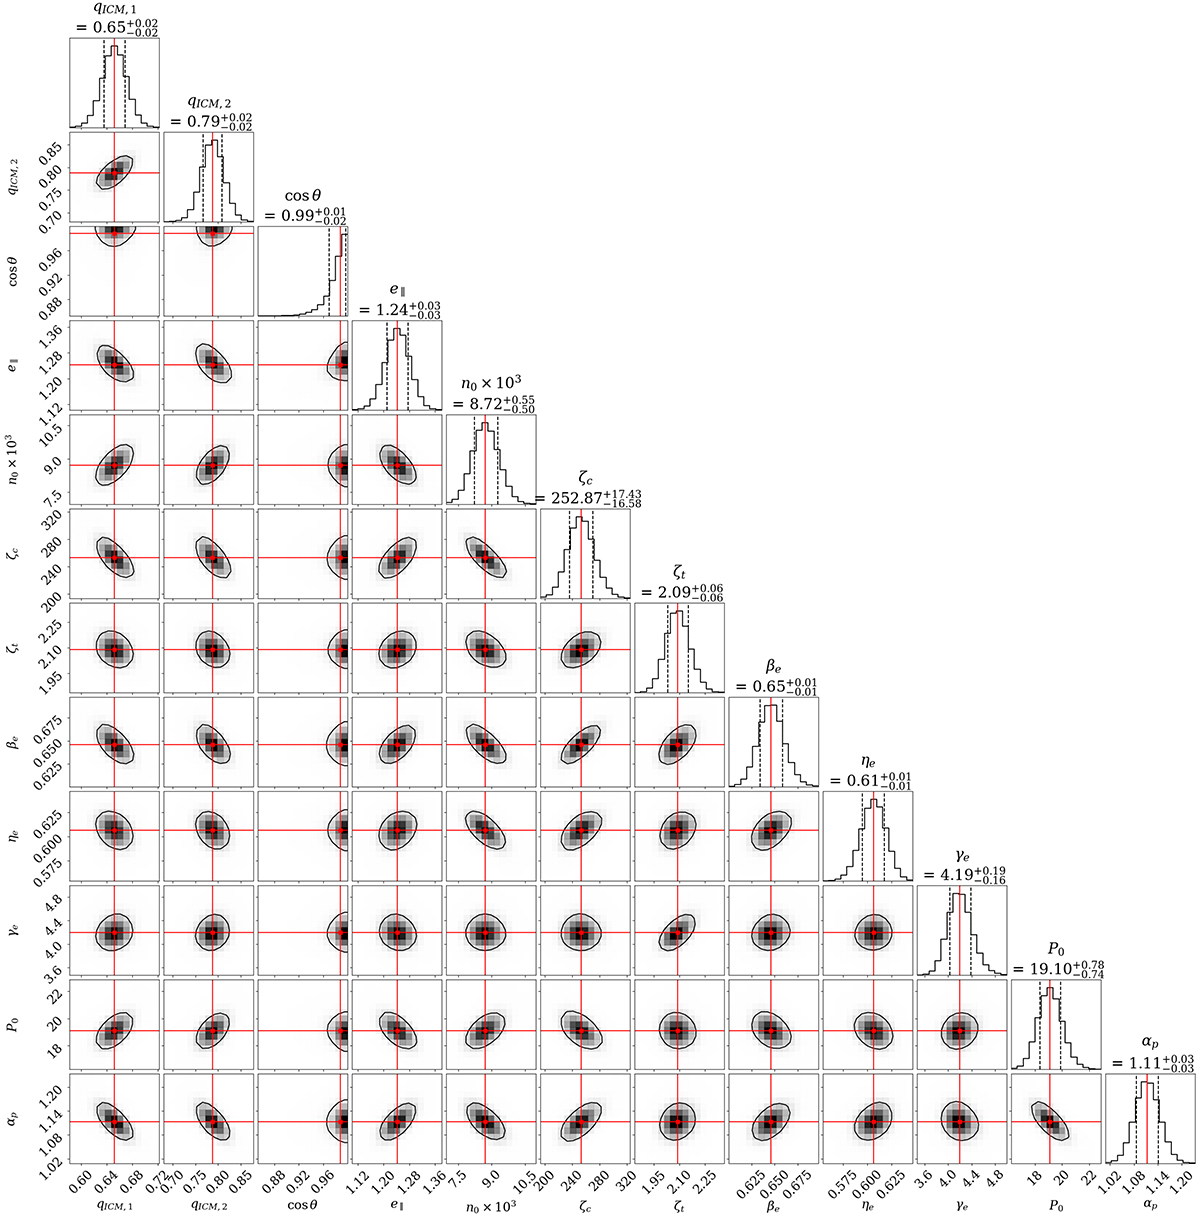
Download original image
Posterior distribution of the model fit parameters for the galaxy cluster PSZ2 G313.33+61.13 obtained using SZ data from Planck and ACT, as well as X-ray data from XMM-Newton. The vertical red lines indicate the median value from the accepted MCMC samples, with values displayed along with their 68% credible regions above each histogram. Instead of the Euler angles φ and ψ, we present e∥, which is a function of five geometric parameters of a triaxial ellipsoid (Eq. (6)).
Current usage metrics show cumulative count of Article Views (full-text article views including HTML views, PDF and ePub downloads, according to the available data) and Abstracts Views on Vision4Press platform.
Data correspond to usage on the plateform after 2015. The current usage metrics is available 48-96 hours after online publication and is updated daily on week days.
Initial download of the metrics may take a while.