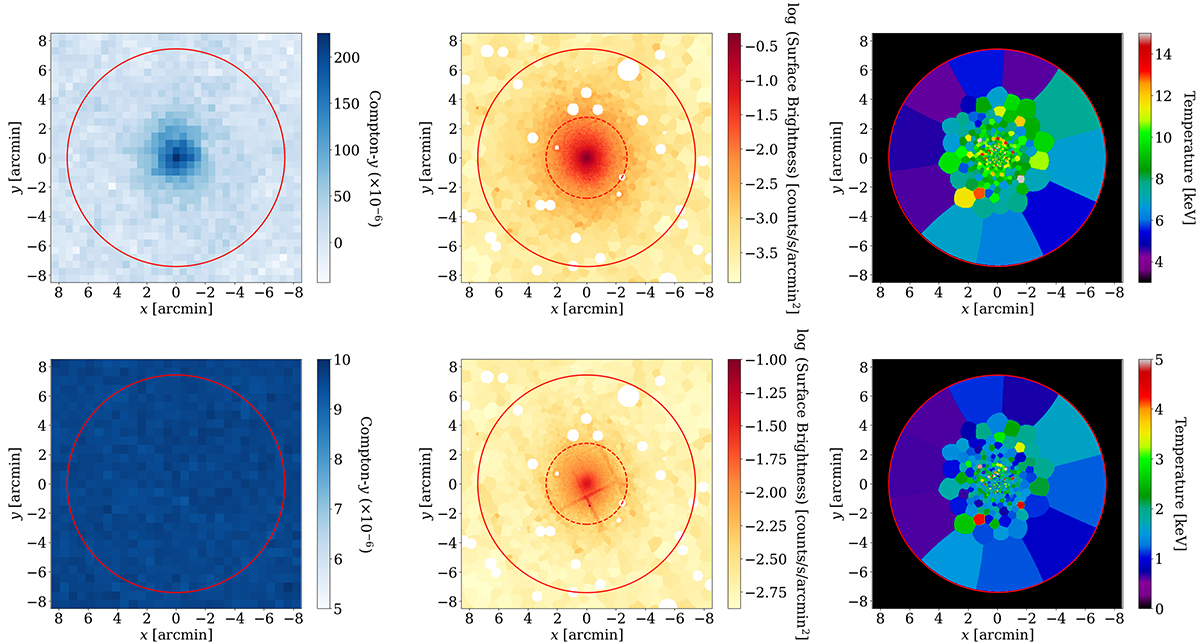
Fig. 5.
Download original image
SZ and X-ray maps of the CHEX-MATE galaxy cluster PSZ2 G313.33+61.13 (Abell 1689). The ACT Compton-y map (top left) and its error map (bottom left), the X-ray SB map (top middle) and its error map (bottom middle), and the X-ray temperature map (top right) and its error map (bottom right) are shown. The ACT SZ map is one of the component-separated map products that were produced using the internal linear combination method and combined with data from Planck (i.e., this is a joint map from ACT + Planck data; Madhavacheril et al. 2020). The X-ray maps are the data products from Bartalucci et al. (2023) and Lovisari et al. (2024). Bright point sources in the X-ray SB maps are indicated by white circles and were masked in the analysis, and the same point-source regions were also removed from the spectral analysis to obtain the temperatures. The regions are excluded from the model fit. The X-ray SB maps were binned using a Voronoi algorithm to ensure an adequate number of photon counts per bin, with smaller bin sizes used in the central region where the count rates are higher. For the temperature maps, Voronoi binning was similarly applied using a fixed signal-to-noise ratio of 30 instead of a fixed number of counts, ensuring a roughly uniform statistical uncertainty per bin. In the X-ray and SZ maps, red circles indicate the two-dimensional map regions included in our analysis. We incorporated a circular region with a radius of r = R500 around the galaxy cluster center for the SZ and X-ray data by applying a circular mask to the maps, and the radius is shown as red circles. For this particular cluster, R500 is equal to 7.42′ (∼1.37 Mpc). In the X-ray SB and its corresponding error maps, dashed red circles represent the region that encompasses 80% of the emission in the SB map, which is where the two-dimensional (inner region) and one-dimensional (outer region) analyses are separated, and it is located at r = 2.58′. We will explore and implement a comparable approach that integrates both two- and one-dimensional analysis techniques for temperature data, as described by Lovisari et al. (2024), in a forthcoming analysis.
Current usage metrics show cumulative count of Article Views (full-text article views including HTML views, PDF and ePub downloads, according to the available data) and Abstracts Views on Vision4Press platform.
Data correspond to usage on the plateform after 2015. The current usage metrics is available 48-96 hours after online publication and is updated daily on week days.
Initial download of the metrics may take a while.