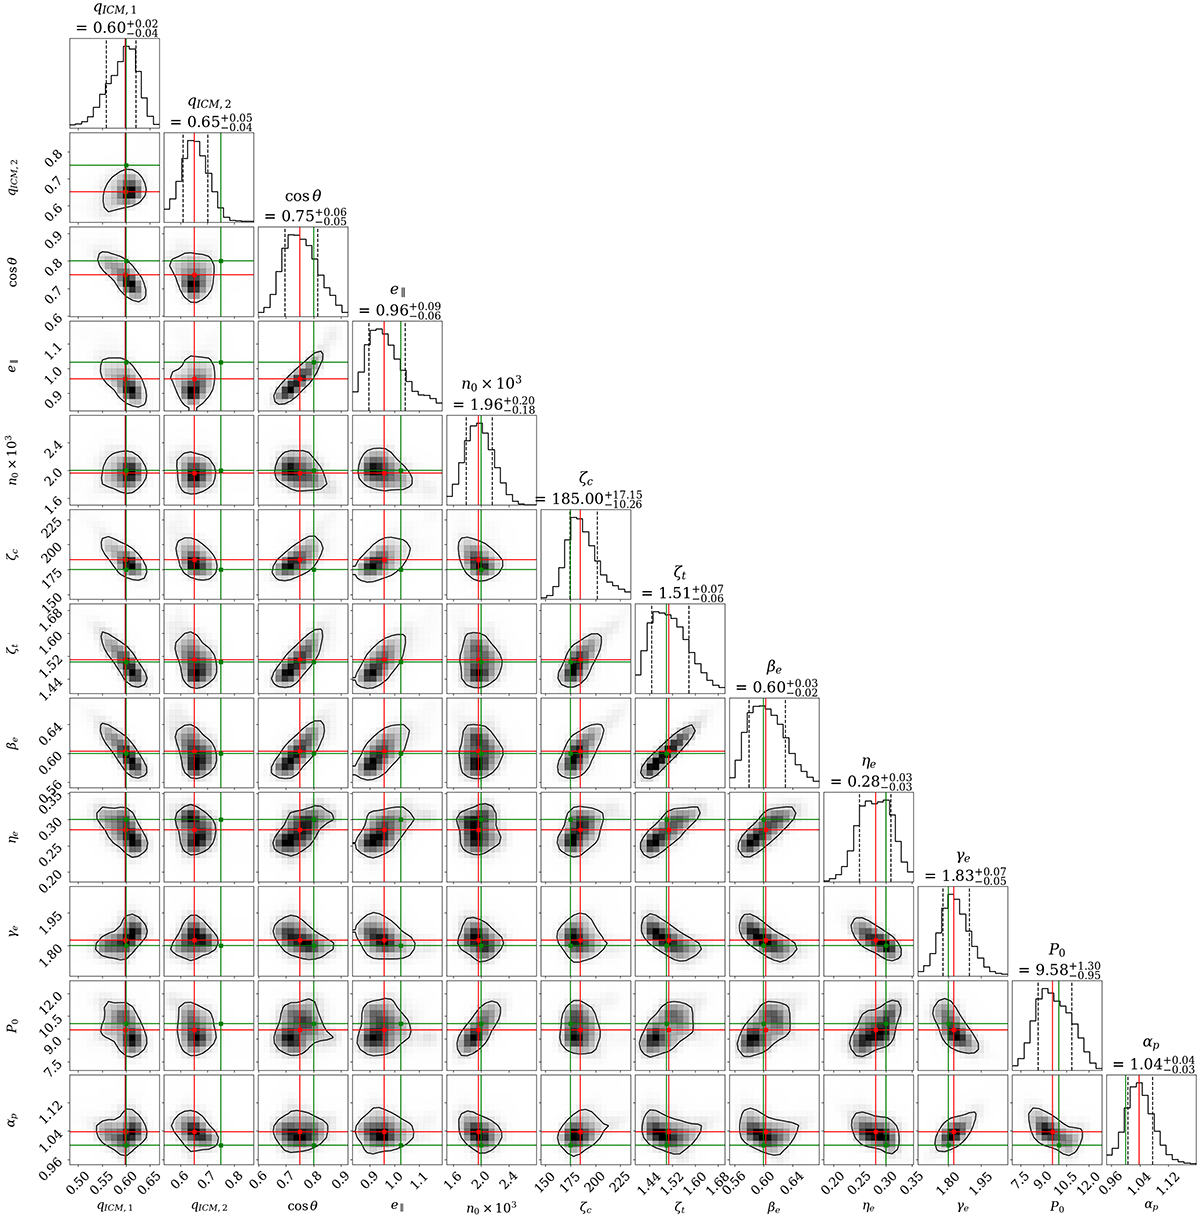
Fig. 3.
Download original image
Posterior distributions estimated from our MCMC for a mock observation generated from a smooth model. The vertical green lines in each plot indicate the input parameters used to generate the mock observation maps, while the vertical red lines represent the median value from the accepted MCMC samples. The values displayed above each histogram show the median of the distribution, along with the 1σ (68.3%) credible region, which is indicated by dashed vertical lines in every plot. Additionally, the solid black line in the two-dimensional distributions encloses the 68% credible region for the parameter pairs. As highlighted by Vikhlinin et al. (2006) and Nagai et al. (2007), there is a correlation between the model parameters related to the ICM radial profiles, and individual parameter values exhibit a degeneracy. However, our objective is to ascertain smooth analytic functions that accurately represent the electron density and pressure profiles, thereby providing a comprehensive description of the ICM thermodynamics.
Current usage metrics show cumulative count of Article Views (full-text article views including HTML views, PDF and ePub downloads, according to the available data) and Abstracts Views on Vision4Press platform.
Data correspond to usage on the plateform after 2015. The current usage metrics is available 48-96 hours after online publication and is updated daily on week days.
Initial download of the metrics may take a while.