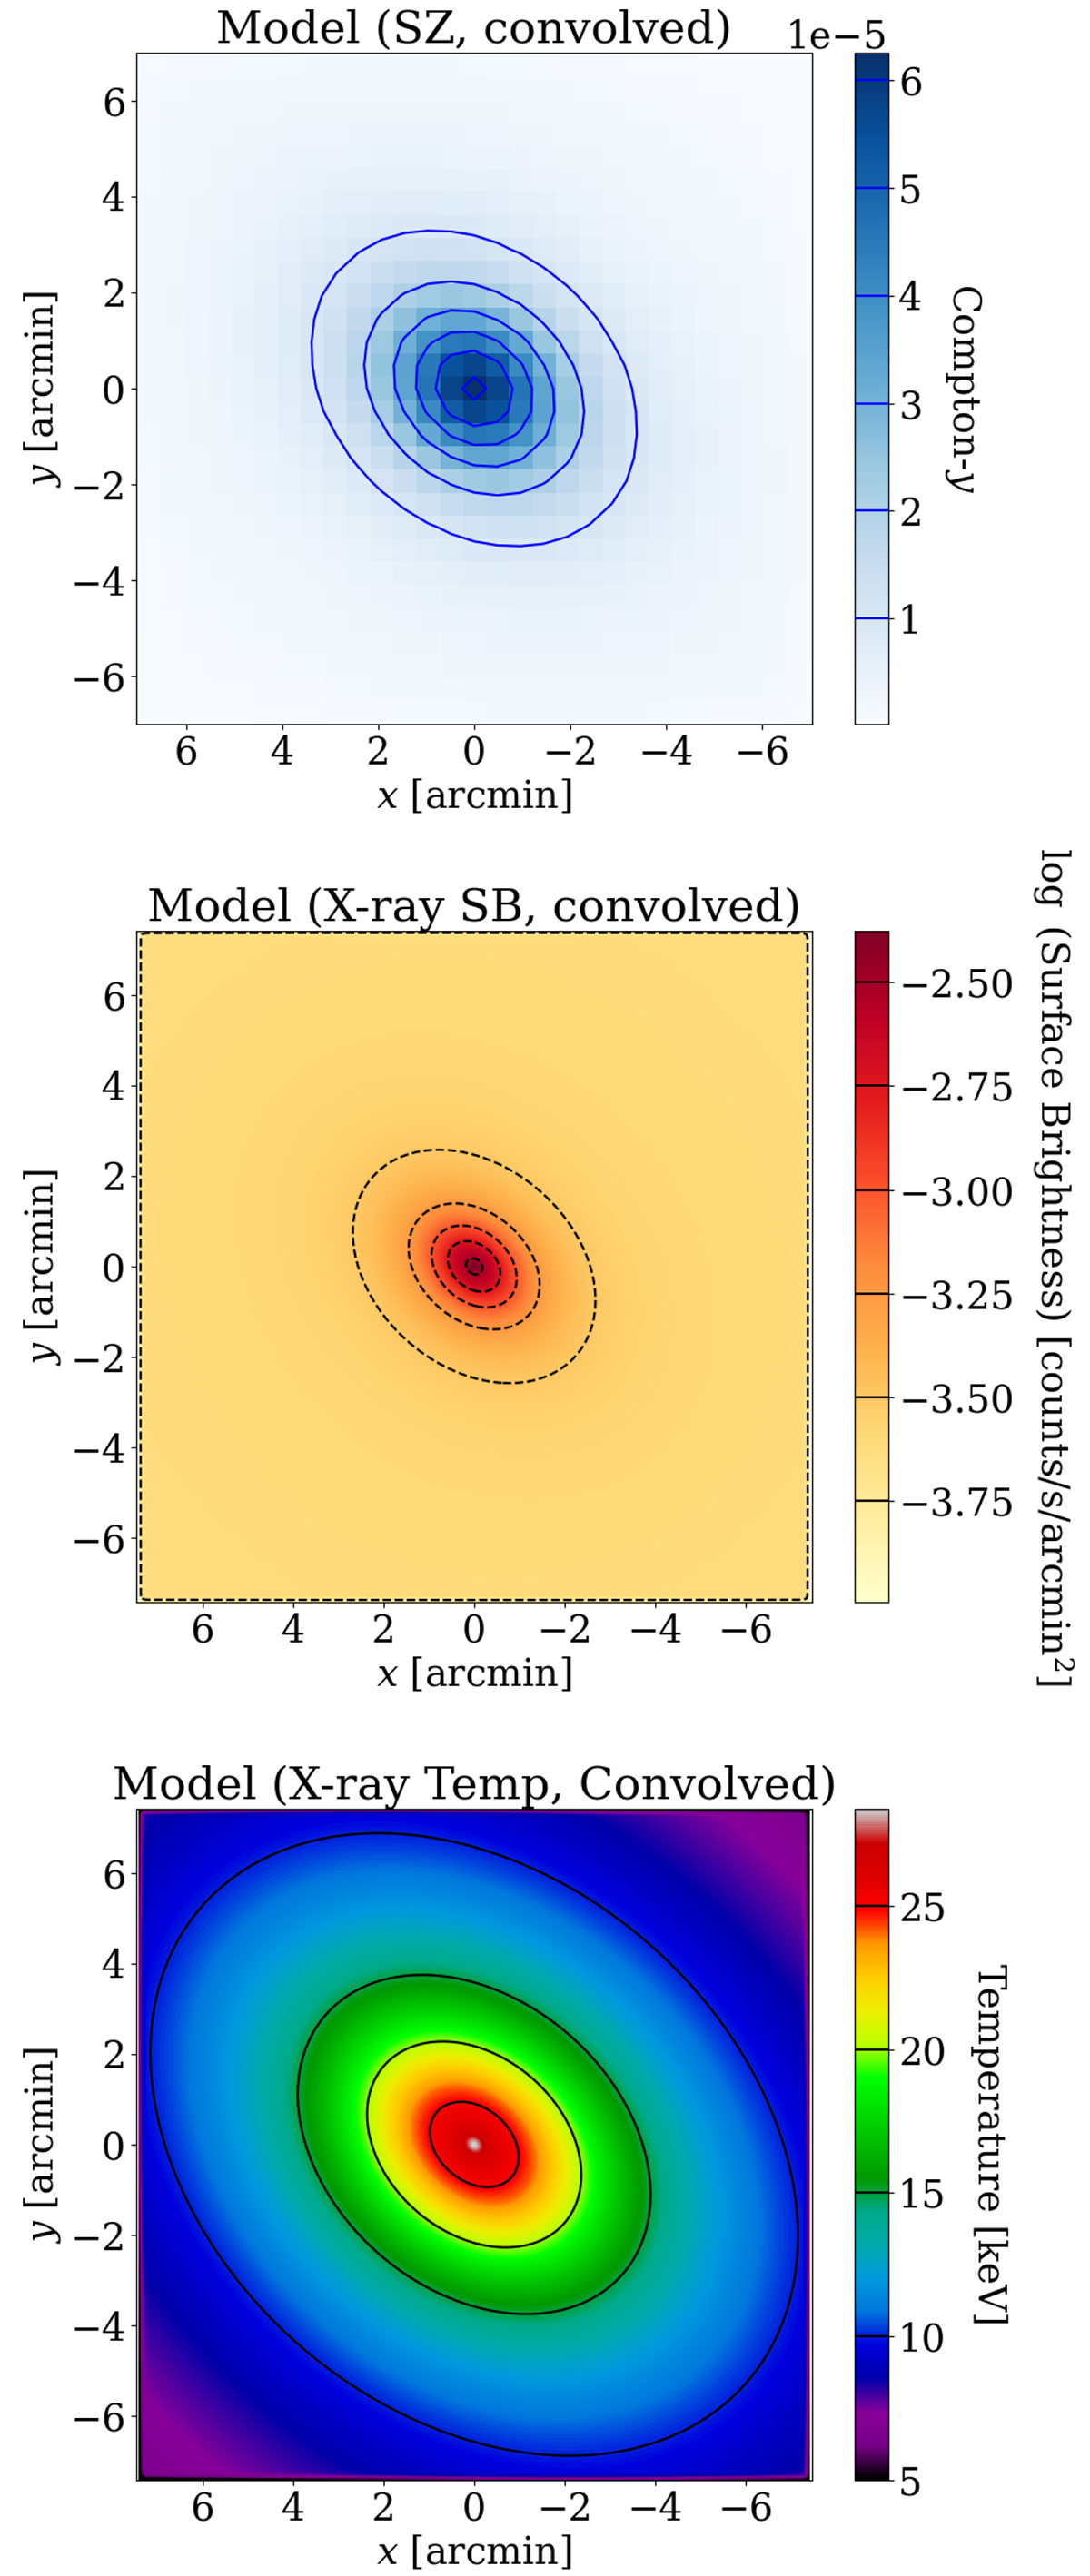
Fig. 2.
Download original image
Projected PSF-convolved SZ model map (top) and PSF convolved X-ray SB (middle) and temperature (bottom) maps. The contours for the models are overlaid to improve the visual representation of the maps. The simulated PSFs used for the SZ and X-ray maps correspond to 1.6′ and 10″ FWHM, respectively. To ensure accurate PSF convolution, we binned the pixels in the maps such that the FWHM of each instrument’s PSF is covered by at least three pixels.
Current usage metrics show cumulative count of Article Views (full-text article views including HTML views, PDF and ePub downloads, according to the available data) and Abstracts Views on Vision4Press platform.
Data correspond to usage on the plateform after 2015. The current usage metrics is available 48-96 hours after online publication and is updated daily on week days.
Initial download of the metrics may take a while.