Fig. 7
Download original image
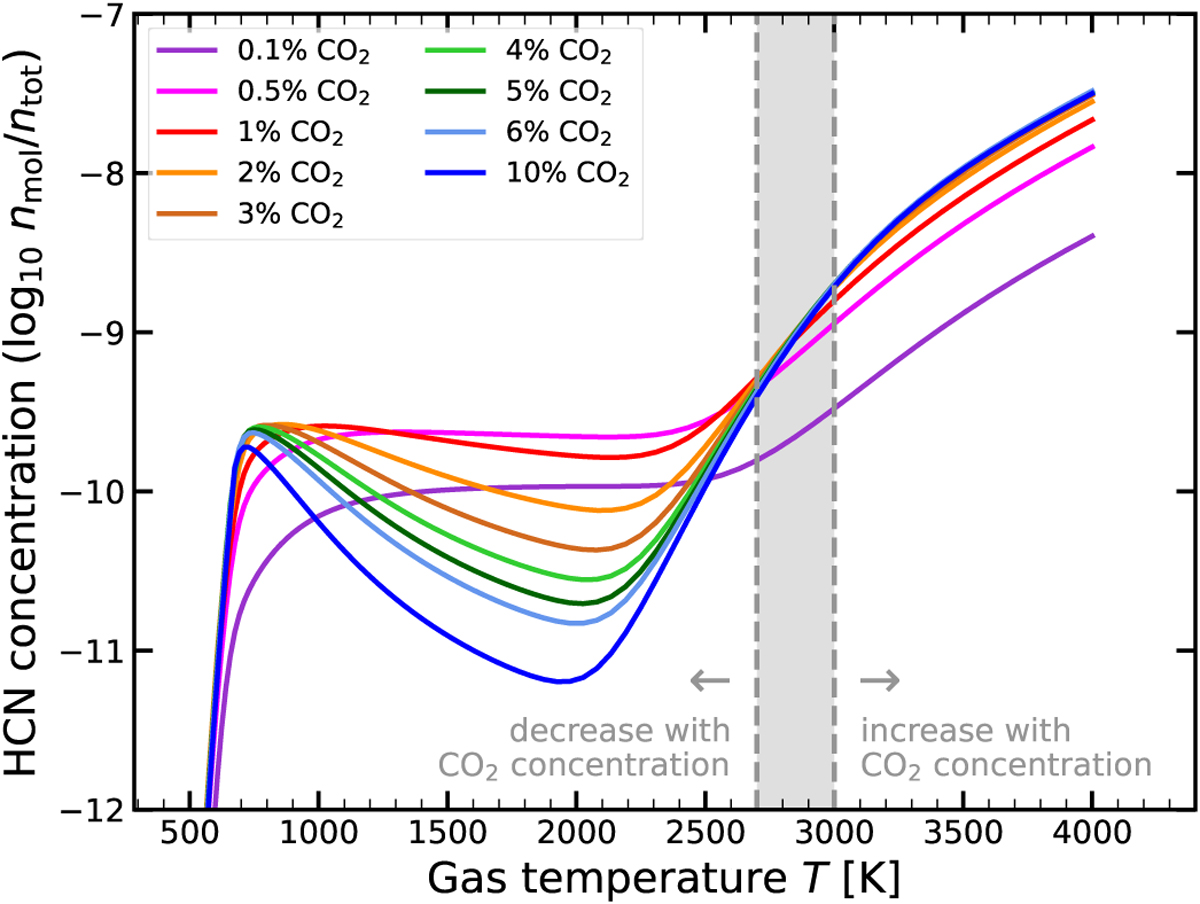
HCN concentration in chemical equilibrium (with GGChem, Woitke & Helling 2003) as function of gas temperature for different CO2 fractions in the gas mixture (other gases: 1% H2, 1% H2O, rest N2). For T ≳ 3000 K (right dashed grey line), HCN concentration increases with increasing CO2 concentration (until ~3–5% CO2). For T ≲ 2700 K HCN concentrations decreases with increasing CO2 concentration (except for 0.1% CO2).
Current usage metrics show cumulative count of Article Views (full-text article views including HTML views, PDF and ePub downloads, according to the available data) and Abstracts Views on Vision4Press platform.
Data correspond to usage on the plateform after 2015. The current usage metrics is available 48-96 hours after online publication and is updated daily on week days.
Initial download of the metrics may take a while.