Fig. 4.
Download original image
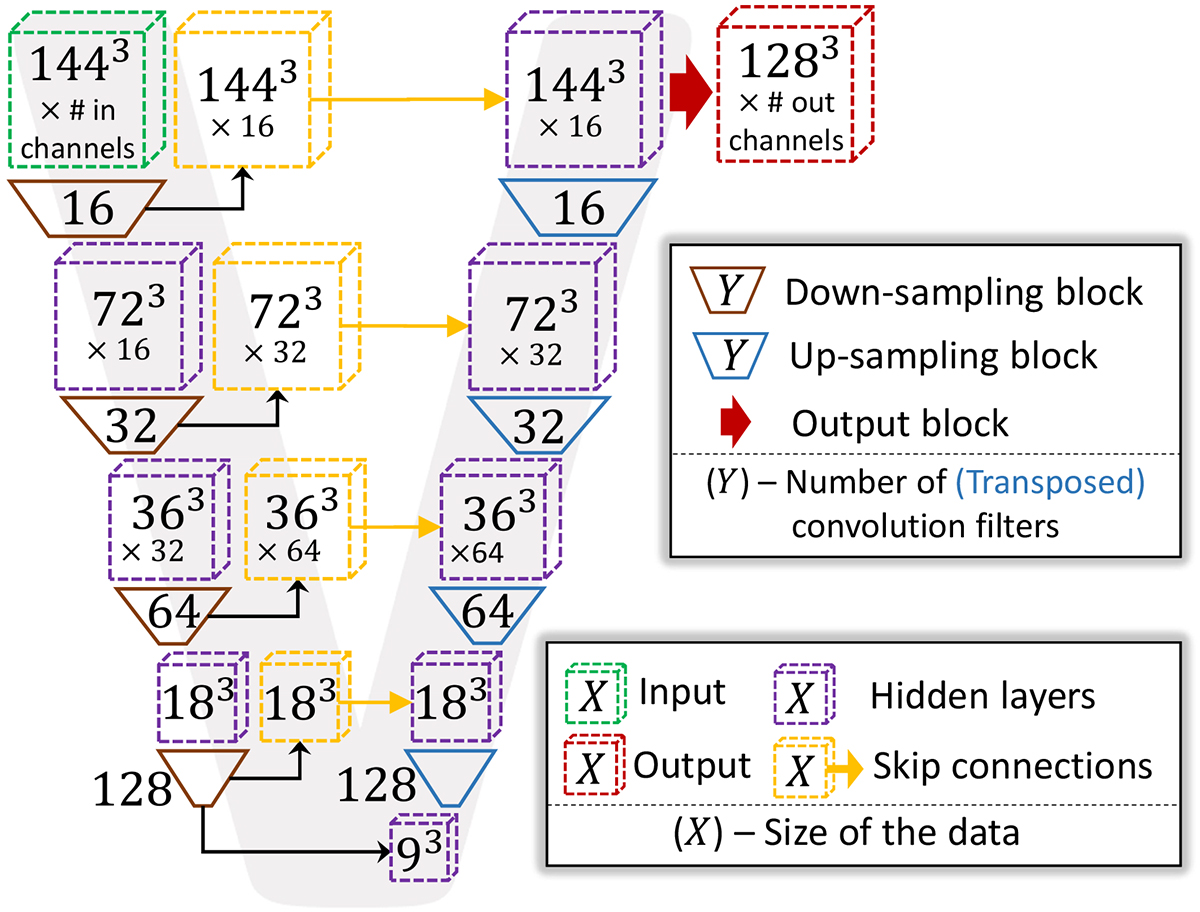
Flowchart of the particular V-Net architecture we have implemented. The network can take as input multiple channels with dimensions of 1443 (top left green cube) and generates predictions for the central voxels with dimensions 1283 (top right red cube). The flowchart illustrates the encoder and decoder paths, along with other distinctive features of the network. Notably, the hidden layers and skip connections are represented by purple and yellow cubes, with their respective dimensions annotated at their centres. The down-sampling and up-sampling blocks are shown as brown and purple trapezoids, in their centres we indicate the number of filters employed for the convolution (or transposed convolution) operations.
Current usage metrics show cumulative count of Article Views (full-text article views including HTML views, PDF and ePub downloads, according to the available data) and Abstracts Views on Vision4Press platform.
Data correspond to usage on the plateform after 2015. The current usage metrics is available 48-96 hours after online publication and is updated daily on week days.
Initial download of the metrics may take a while.