Fig. 2.
Download original image
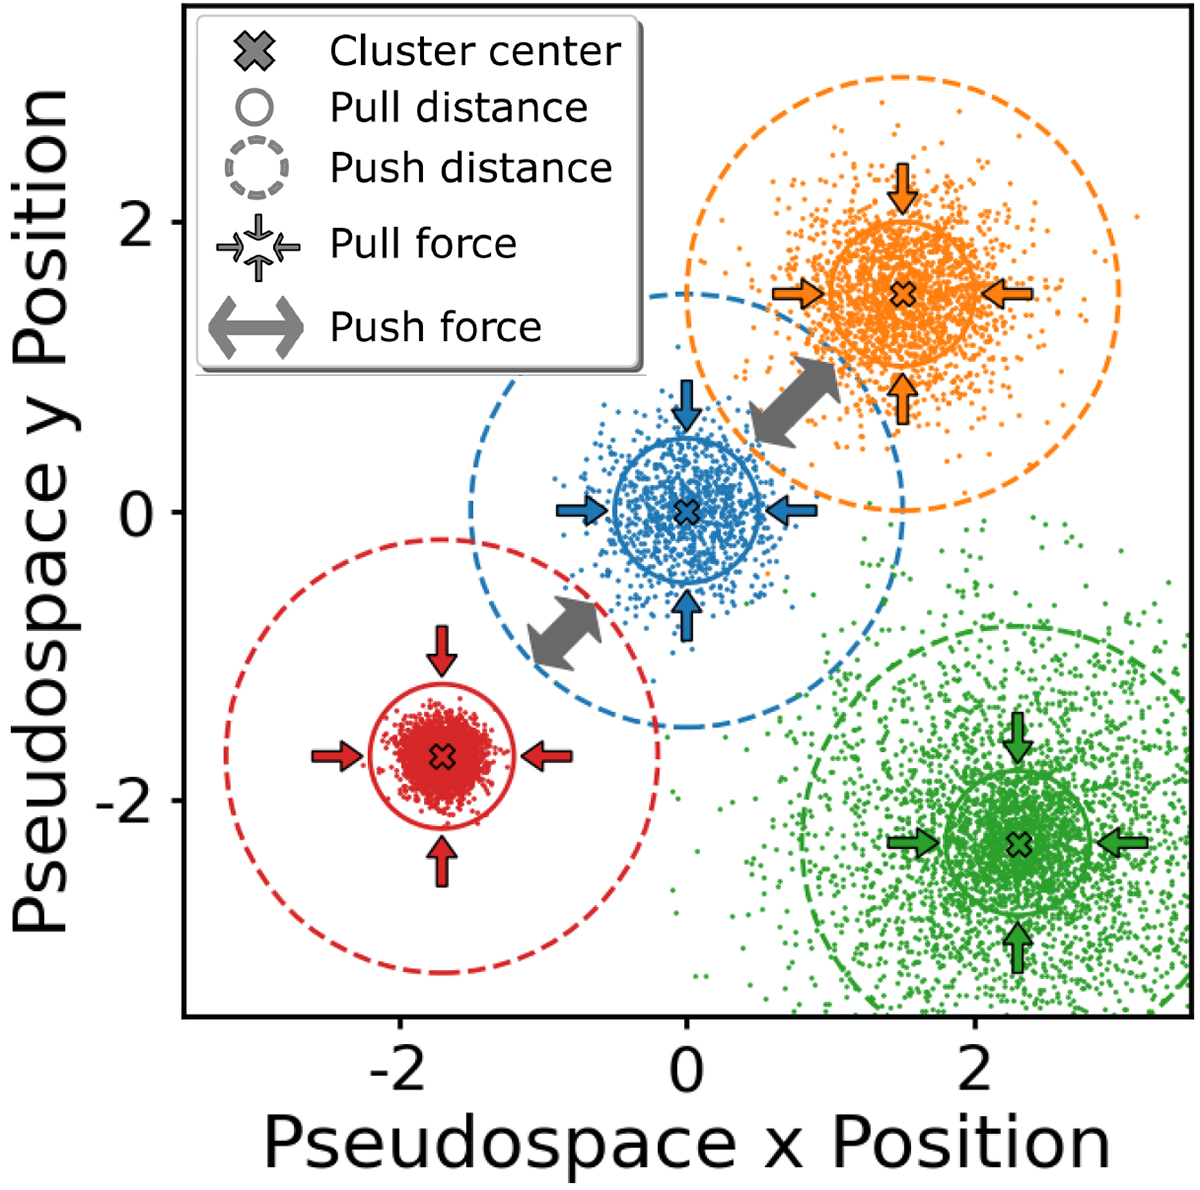
Example of a two-dimensional pseudo-space employed to separate different instances according to the Weinberger loss. Coloured points represent individual points mapped into the pseudo-space. The centres of the clusters are presented as coloured crosses. Coloured arrows depict the influence of the pull force term, only affecting points outside the δPull range of their corresponding cluster centre. Grey arrows show the influence of the push force that manifests if two cluster centres are closer than the distance 2 ⋅ δPush.
Current usage metrics show cumulative count of Article Views (full-text article views including HTML views, PDF and ePub downloads, according to the available data) and Abstracts Views on Vision4Press platform.
Data correspond to usage on the plateform after 2015. The current usage metrics is available 48-96 hours after online publication and is updated daily on week days.
Initial download of the metrics may take a while.