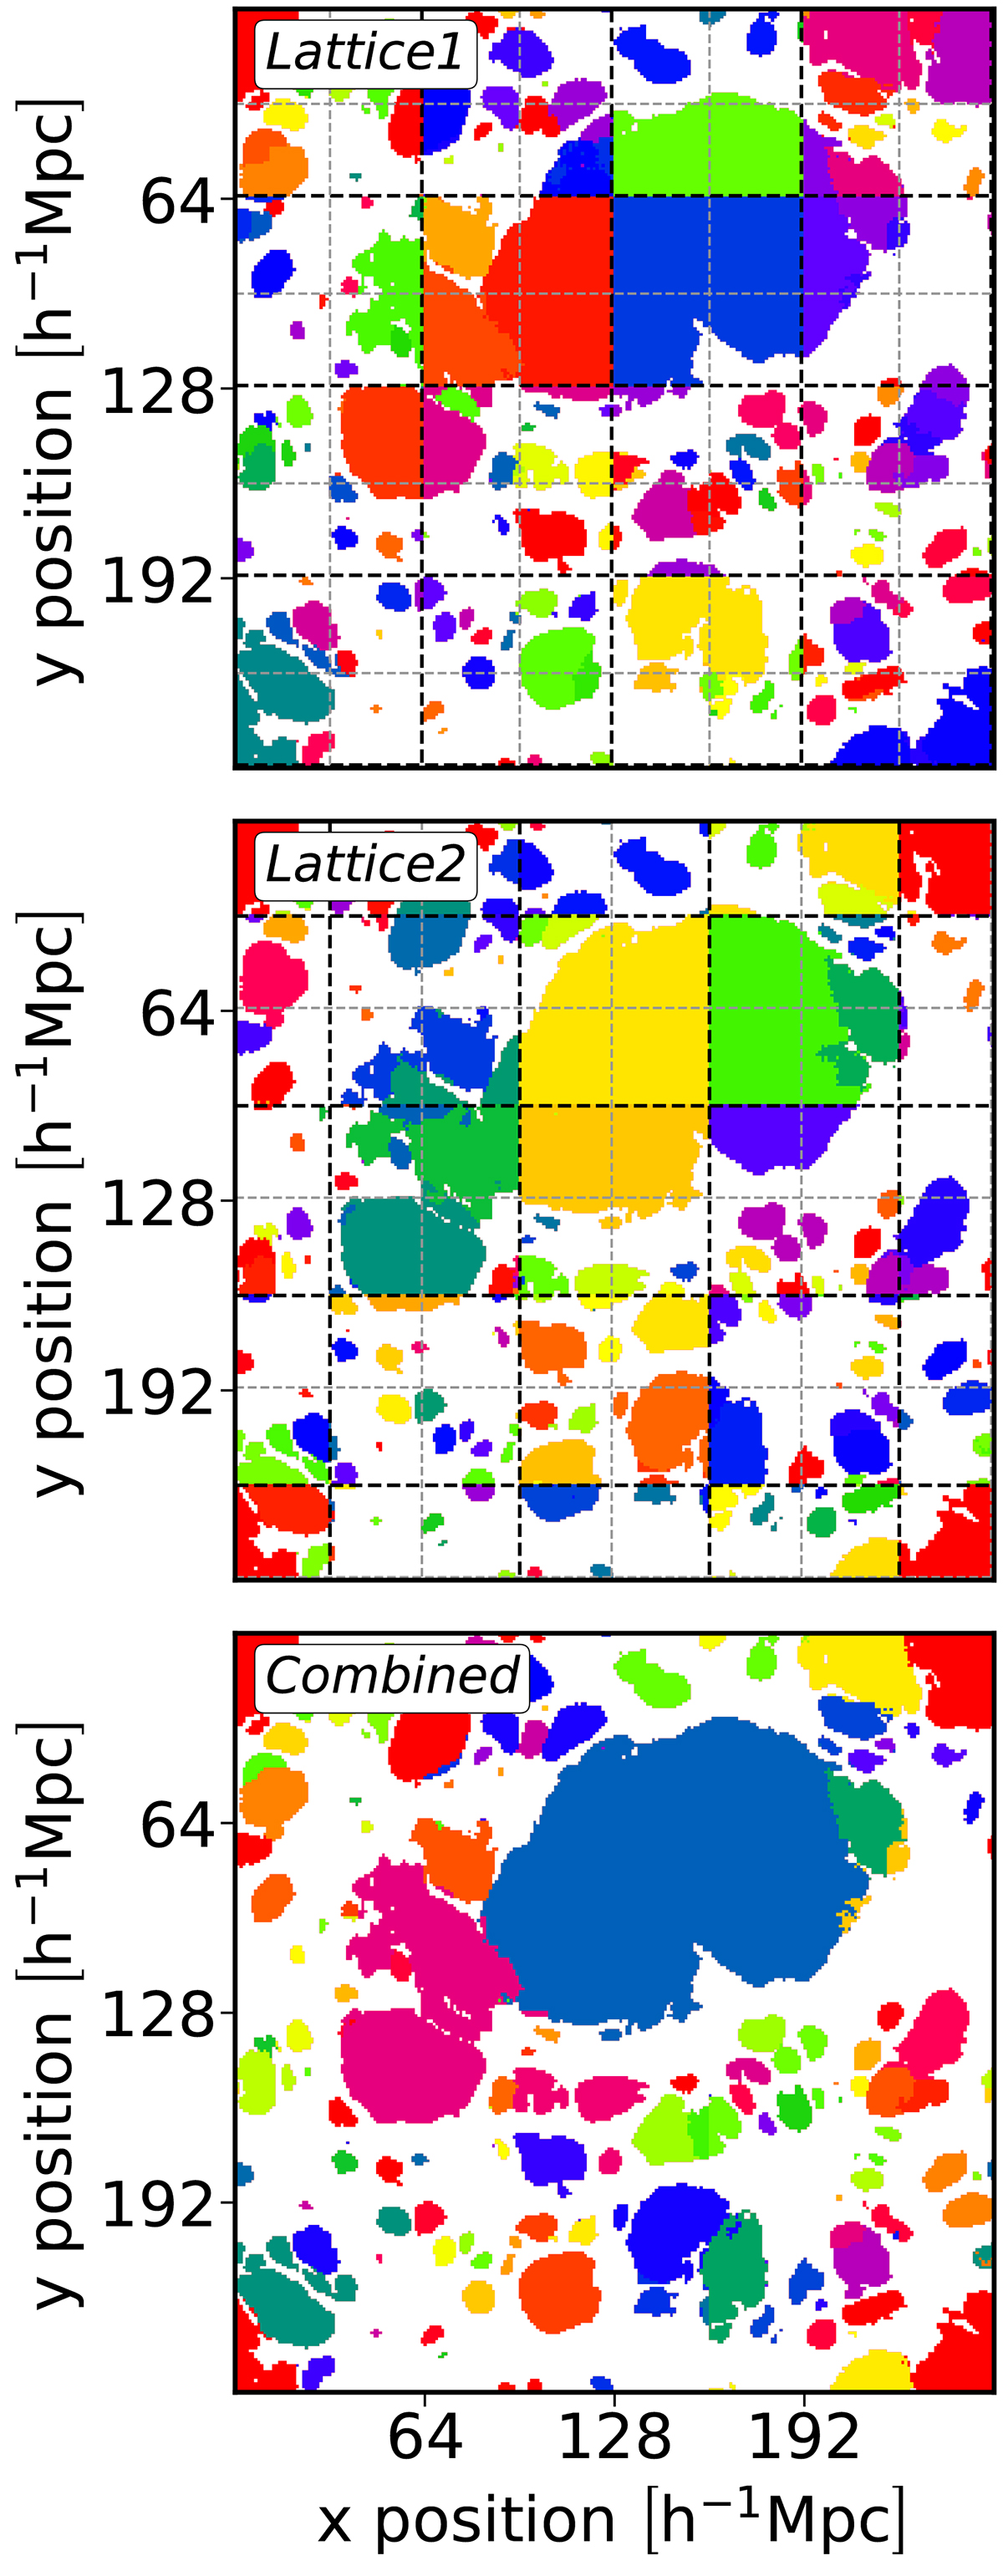
Fig. D.1.
Download original image
Process of merging predictions from two overlapping lattice structures to produce a full-box instance segmentation map. ’Lattice1’ (top) and ’Lattice2’ (middle) represent predictions from initial and shifted lattice grids, respectively, with unique colour-coded labels for instances. Black dashed lines indicate the lattice employed in each case, while thin dashed grey lines correspond to the lattice employed in the reciprocal scenario. ’Combined’ (bottom) depicts the final synthesized full-box map, where instances have been merged based on their overlap, demonstrating the effectiveness of the methodology in generating contiguous and comprehensive halo segmentations from smaller, predicted sub-volumes.
Current usage metrics show cumulative count of Article Views (full-text article views including HTML views, PDF and ePub downloads, according to the available data) and Abstracts Views on Vision4Press platform.
Data correspond to usage on the plateform after 2015. The current usage metrics is available 48-96 hours after online publication and is updated daily on week days.
Initial download of the metrics may take a while.