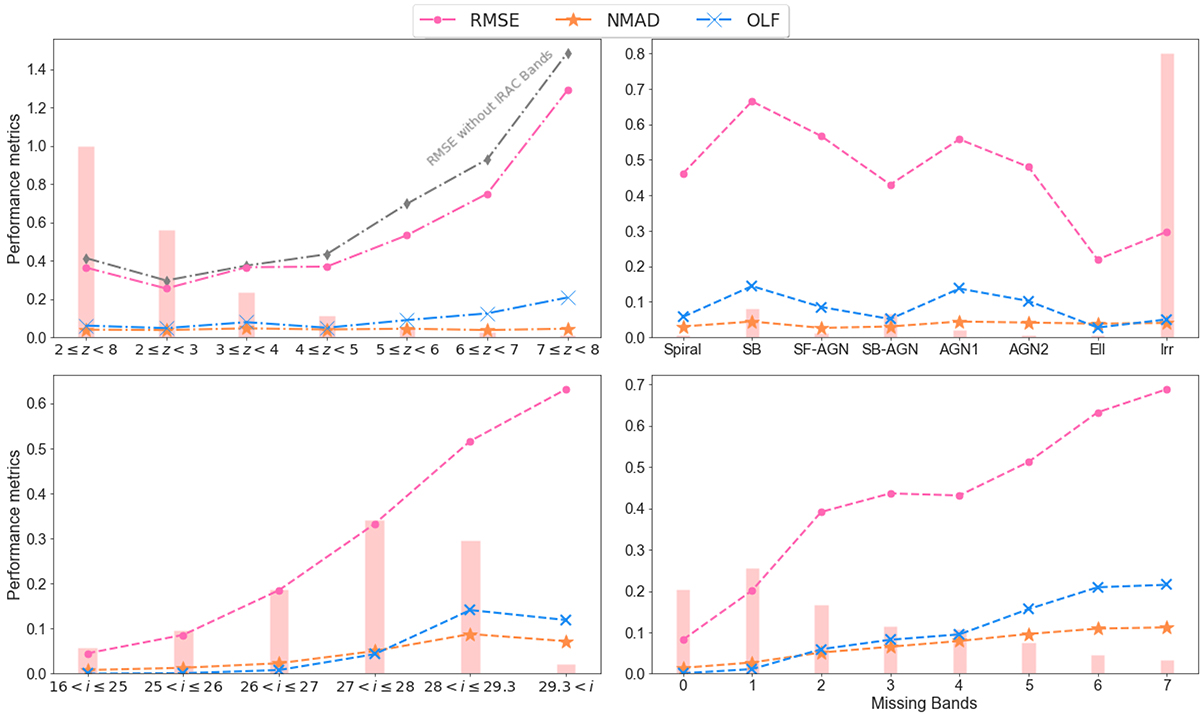
Fig. 7.
Download original image
XGBoost test set RMSE, OLF, and NMAD (starting from the upper-left panel and going clockwise) for different redshift intervals, SED types, numbers of missing bands, and i-band magnitudes. The grey curve shows the RMSE obtained by removing the two IRAC bands from the XGBoost input. The vertical pink bands indicate the fraction of objects belonging to the group with respect to the test set size. For details, refer to Table B.1.
Current usage metrics show cumulative count of Article Views (full-text article views including HTML views, PDF and ePub downloads, according to the available data) and Abstracts Views on Vision4Press platform.
Data correspond to usage on the plateform after 2015. The current usage metrics is available 48-96 hours after online publication and is updated daily on week days.
Initial download of the metrics may take a while.