Fig. 1.
Download original image
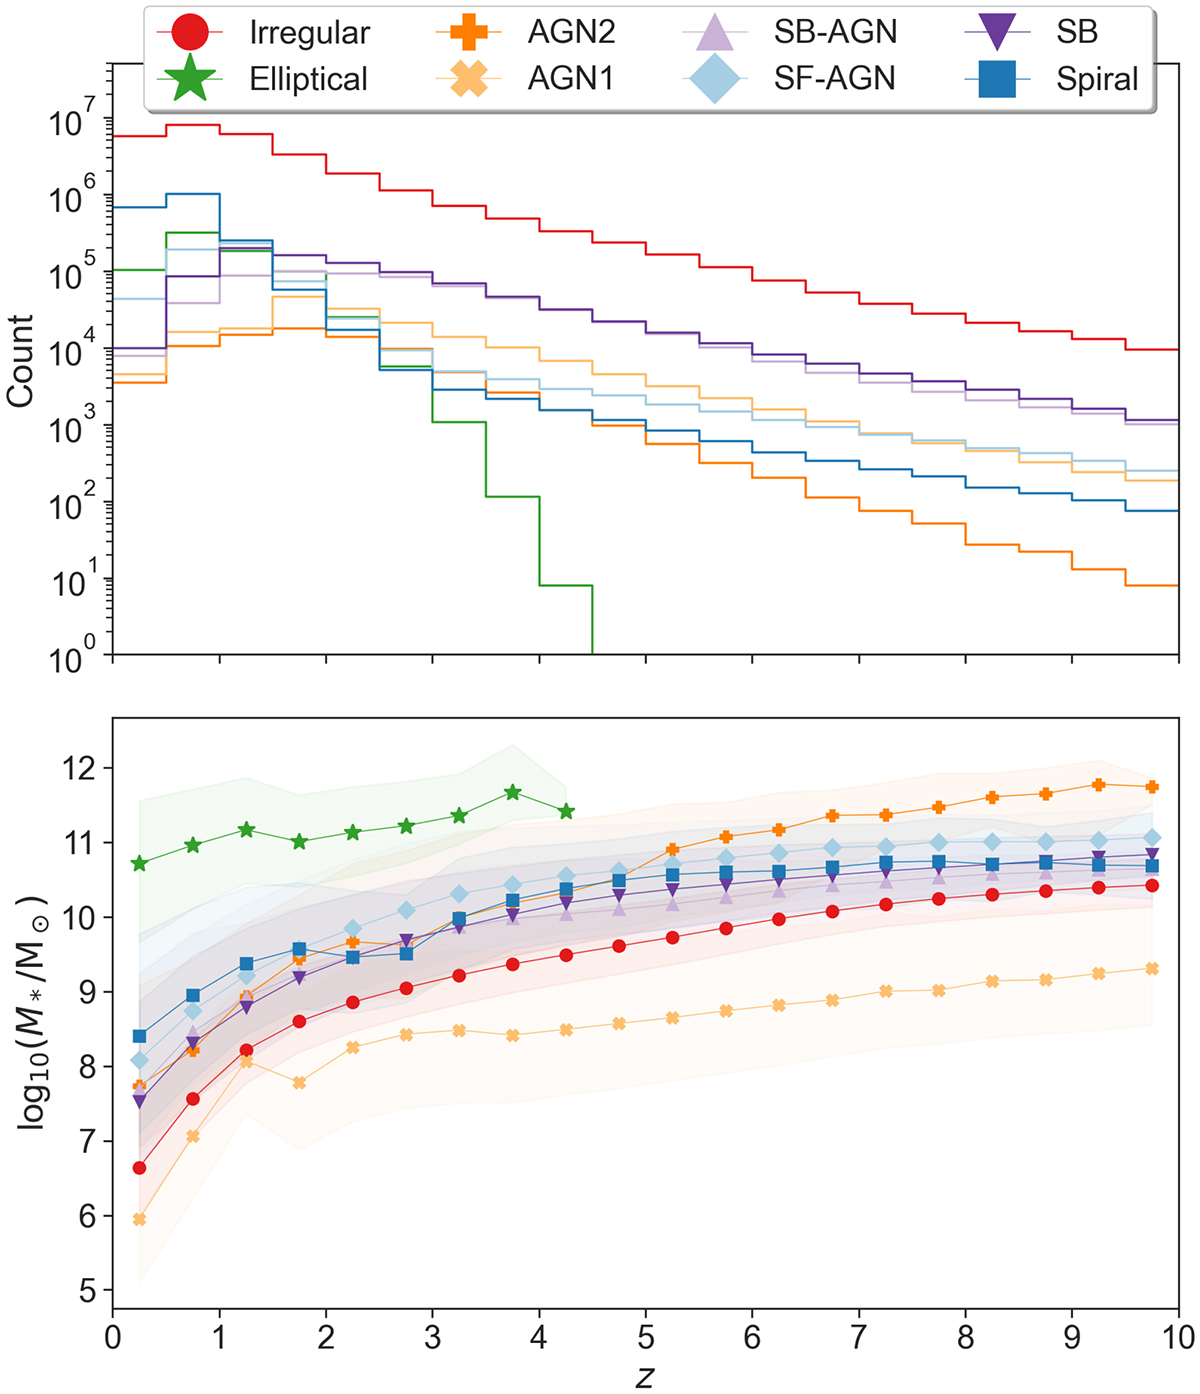
Redshift distribution (top) and stellar mass as a function of redshift (bottom) of the simulated galaxies obtained with SPRITZ for the Euclid Deep Survey, colour-coded by their SED type (see the legend). Markers represent the median value in the redshift bin and shaded areas the corresponding 68% coverage interval. For details about the mass function distribution at different redshift ranges, we refer the reader to Bisigello et al. (2021).
Current usage metrics show cumulative count of Article Views (full-text article views including HTML views, PDF and ePub downloads, according to the available data) and Abstracts Views on Vision4Press platform.
Data correspond to usage on the plateform after 2015. The current usage metrics is available 48-96 hours after online publication and is updated daily on week days.
Initial download of the metrics may take a while.