Fig. 5.
Download original image
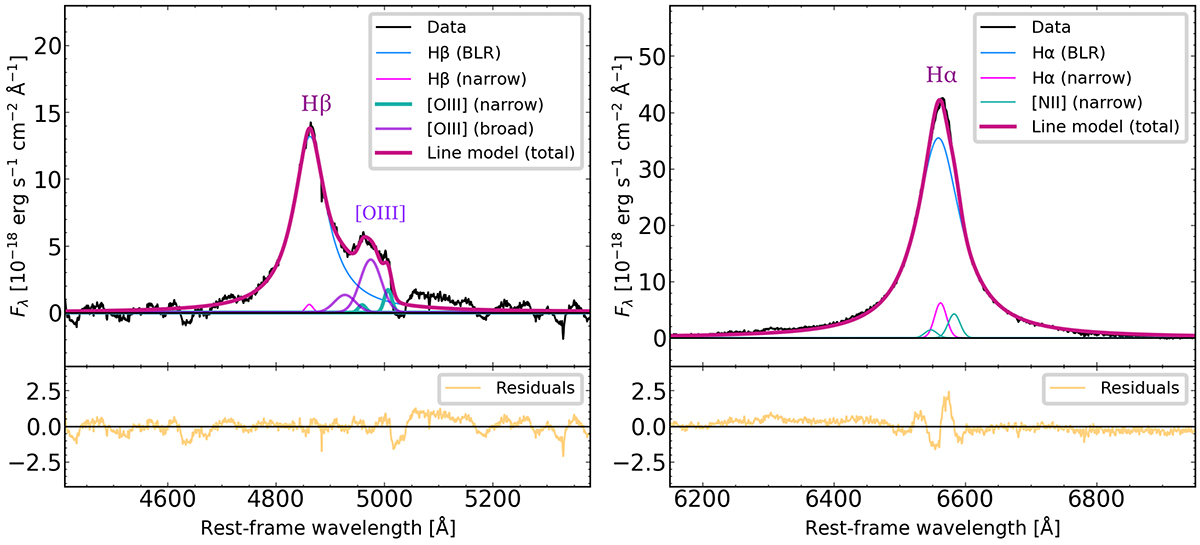
Fit of the Hβ + [O III] (left) and Hα + [N II] lines (right), after the continuum and iron subtraction. We modeled the BLR Hβ and Hα lines using two Lorentzian functions (one for each line). The nebular lines from the NLR ([O III], [N II], Hα, and Hβ narrow components) were each fitted with a Gaussian. We added two further Gaussian components (purple; “broad” components in the paper) to fit the emission around 5000 Å, likely associated with blueshifted [O III] (see also Sect. 4.4 and Fig. 8). The residuals are shown in orange.
Current usage metrics show cumulative count of Article Views (full-text article views including HTML views, PDF and ePub downloads, according to the available data) and Abstracts Views on Vision4Press platform.
Data correspond to usage on the plateform after 2015. The current usage metrics is available 48-96 hours after online publication and is updated daily on week days.
Initial download of the metrics may take a while.