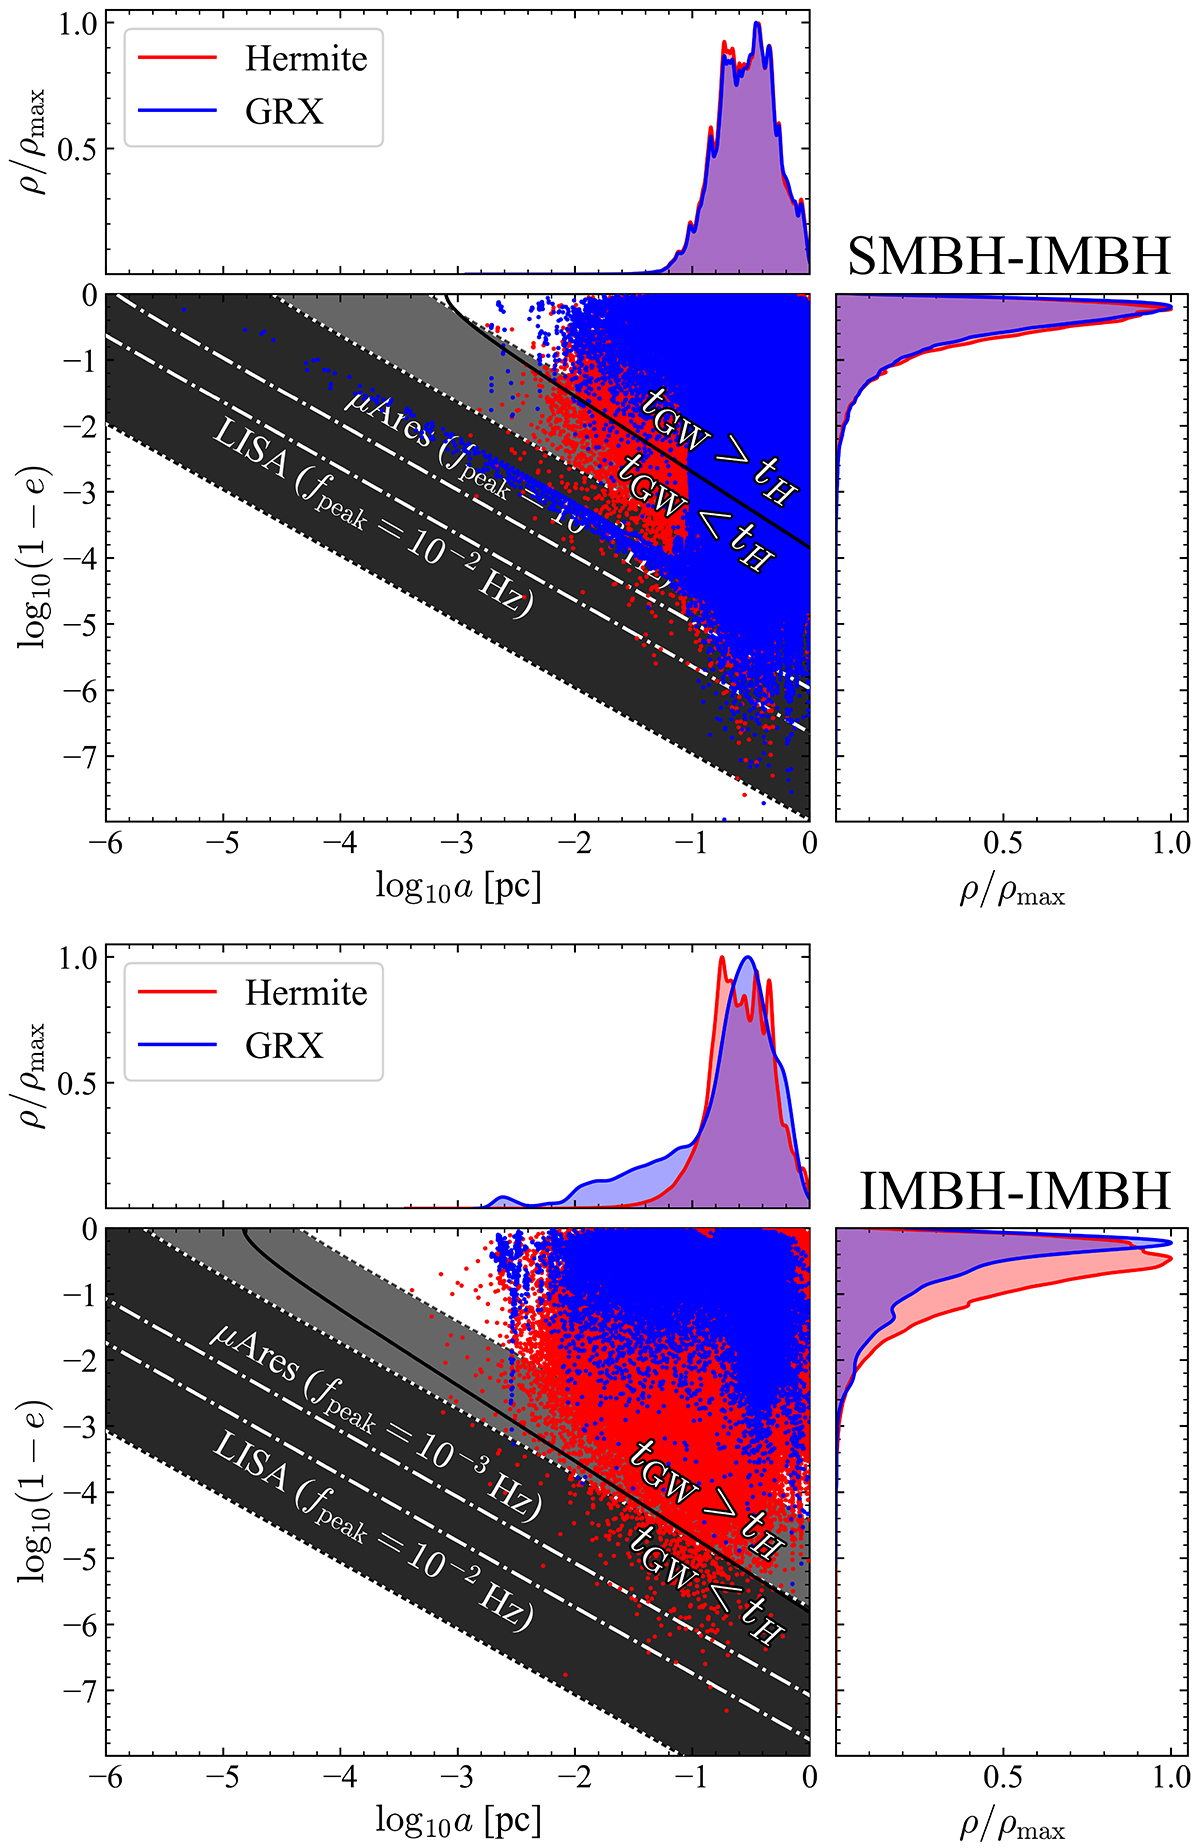
Fig. 16.
Download original image
Scatter plot denoting where Hermite and GRX GW events lie in the a vs. log10(1 − e) parameter space. The panels above and on the right show the kernel density estimate. The greyed-out regions denote the frequency range probed by LISA and μAres. The dashed-dotted lines show where the sensitivity of the interferometers is at a maximum, while the dotted ones the frequency range probed (Sesana et al. 2021; Samsing et al. 2014), with the upper bounds for μAres and LISA being the same (f = 1 Hz). The data here is from runs simulated with NIMBH ≤ 40. Top: SMBH-IMBH GW events. Bottom: IMBH-IMBH GW events.
Current usage metrics show cumulative count of Article Views (full-text article views including HTML views, PDF and ePub downloads, according to the available data) and Abstracts Views on Vision4Press platform.
Data correspond to usage on the plateform after 2015. The current usage metrics is available 48-96 hours after online publication and is updated daily on week days.
Initial download of the metrics may take a while.