Fig. 9
Download original image
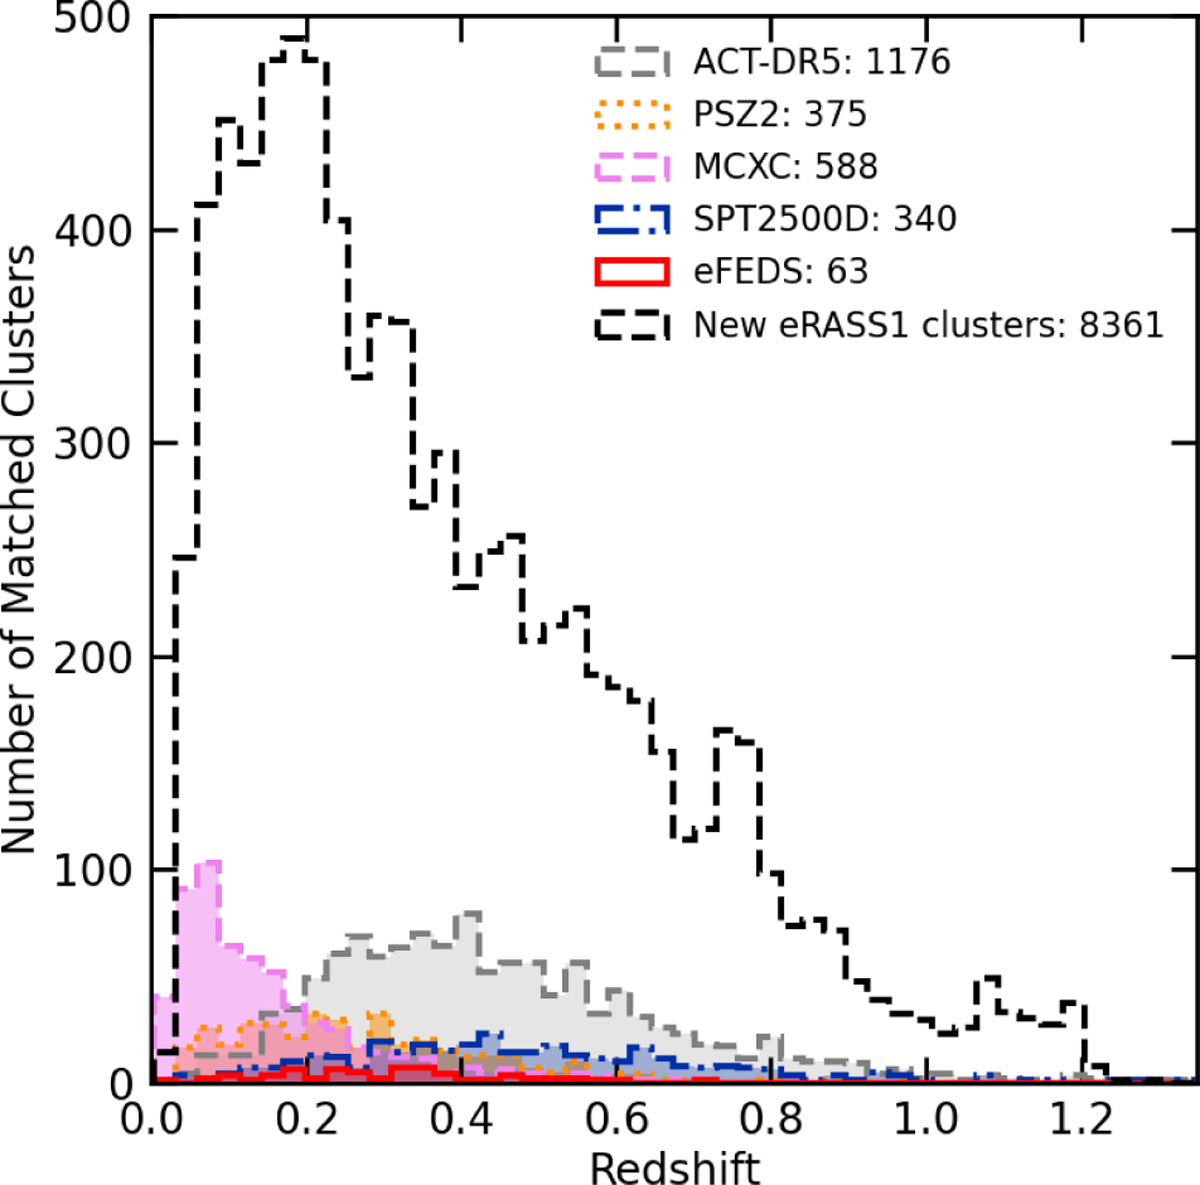
Redshift histogram of the matched eRASS1 clusters in the ROSAT, Planck All-Sky Surveys, ACT, and SPT-SZ surveys and the newly discovered eRASS1 clusters. The redshifts indicated here are adopted from the literature catalogs that are matched. For the eRASS1 catalog, zbest is used in the histogram. The largest overlap of clusters (1176) is between RASS and ACT DR5 surveys due to the large common area between the two surveys with eROSITA.
Current usage metrics show cumulative count of Article Views (full-text article views including HTML views, PDF and ePub downloads, according to the available data) and Abstracts Views on Vision4Press platform.
Data correspond to usage on the plateform after 2015. The current usage metrics is available 48-96 hours after online publication and is updated daily on week days.
Initial download of the metrics may take a while.