Fig. 18
Download original image
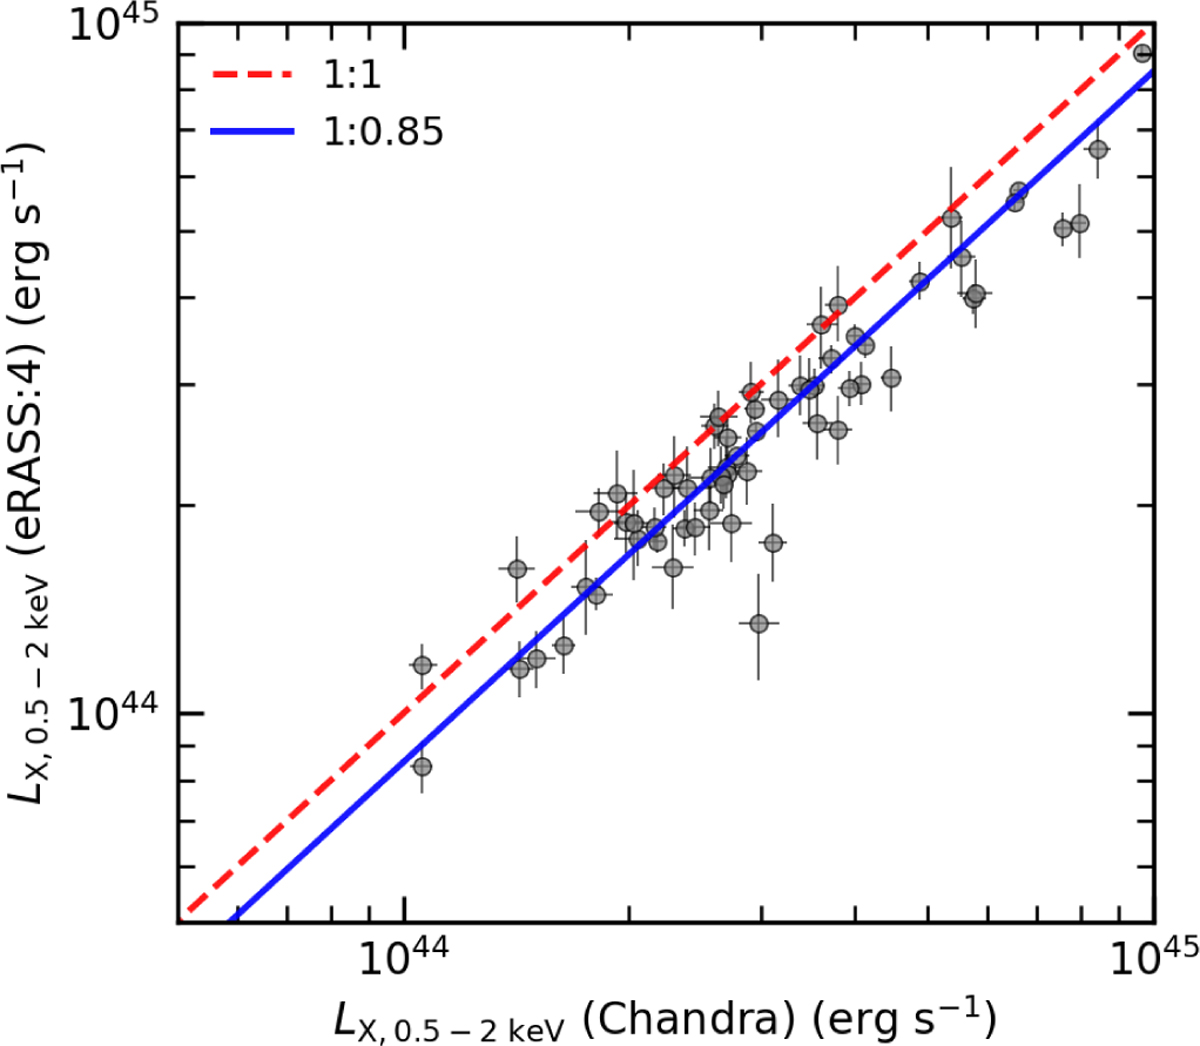
Chandra and eROSITA luminosities of a sample of SPT-selected galaxy clusters. Luminosities are calculated in the 0.5–2.0 keV rest-frame band within a projected radius of 600 kpc. In this plot, only those clusters with an uncertainty of less than 10% from Chandra and 20% from eROSITA are shown (66 out of83). The median ratio between the values suggests that the eROSITA luminosities are lower than the Chandra ones by around 15%.
Current usage metrics show cumulative count of Article Views (full-text article views including HTML views, PDF and ePub downloads, according to the available data) and Abstracts Views on Vision4Press platform.
Data correspond to usage on the plateform after 2015. The current usage metrics is available 48-96 hours after online publication and is updated daily on week days.
Initial download of the metrics may take a while.