Fig. 14
Download original image
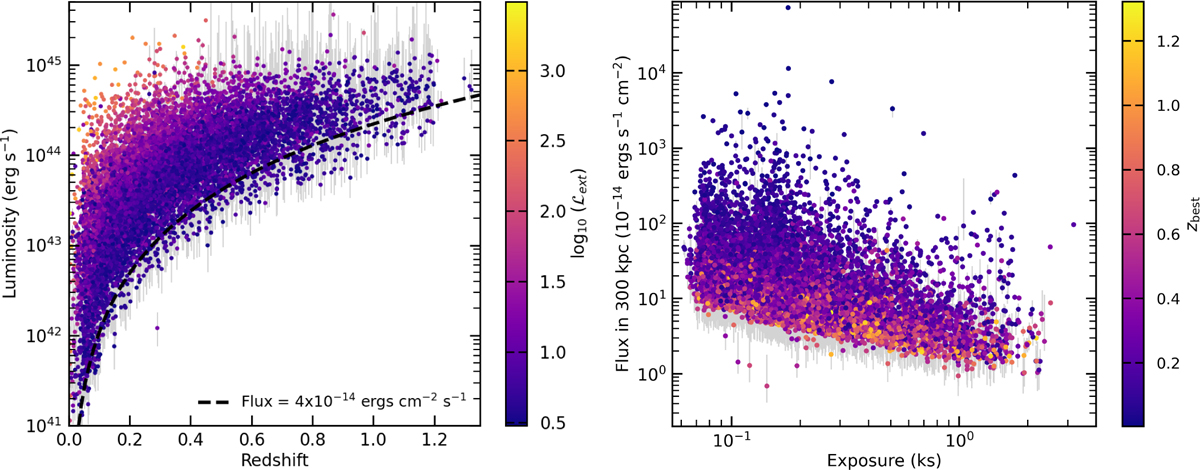
Soft band luminosity distribution of the eRASS1 clusters with redshift shown on the left panel. We only show the luminosities with significant detection at a >2σ confidence for demonstration purposes. The flux value of 4 × 10⁻¹⁴ erg s−1 cm−2 is overplotted as the dashed line. We do not use a flux limit to select clusters; the flux limit is plotted here as a reference. On the right panel, flux within 300 kpc is displayed as a function of exposure time. We only present the significant flux detections with detection confidence >2 σ; the upper limits are excluded from the figure. The color bar indicates zbest. The figure demonstrates that the detection of sources depends on the survey’s depth.
Current usage metrics show cumulative count of Article Views (full-text article views including HTML views, PDF and ePub downloads, according to the available data) and Abstracts Views on Vision4Press platform.
Data correspond to usage on the plateform after 2015. The current usage metrics is available 48-96 hours after online publication and is updated daily on week days.
Initial download of the metrics may take a while.