| Issue |
A&A
Volume 685, May 2024
|
|
|---|---|---|
| Article Number | A81 | |
| Number of page(s) | 8 | |
| Section | Galactic structure, stellar clusters and populations | |
| DOI | https://doi.org/10.1051/0004-6361/202348231 | |
| Published online | 08 May 2024 | |
Contribution of very massive stars to the sulfur abundance in star-forming galaxies: Role of pair-instability supernovae
1
Department of Applied Physics, University of Cádiz, Campus of Puerto Real, 11510 Cádiz, Spain
e-mail: This email address is being protected from spambots. You need JavaScript enabled to view it.
2
Instituto de Astrofísica de Andalucía – CSIC, Apdo 3004, 18080 Granada, Spain
3
INAF-OATs, Via G. B. Tiepolo 11, 34143 Trieste, Italy
4
IFPU – Institute for Fundamental Physics of the Universe, Via Beirut 2, 34014 Trieste, Italy
5
SISSA, Via Bonomea 265, 34136 Trieste, Italy
Received:
11
October
2023
Accepted:
20
February
2024
Abstract
Context. Recent work presented increasing evidence of high non-constant S/O abundance ratios observed in star-forming metal-poor galaxies that deviated from the constant canonical S/O across a wide range of O/H abundances. Similar peculiarly high Fe/O ratios have also recently been detected.
Aims. We investigate whether these high S/O ratios at low metallicities could be explained when the process of pair-instability supernovae (PISN) in chemical modelling is included, through which a similar behaviour of the Fe/O ratios was reproduced successfully.
Methods. We used chemical evolution models that considered the stages of PISN in the previously published yields and adopted a suitable initial mass function (IMF) to characterize this evolutionary stage appropriately.
Results. The peculiarly high values and the behaviour of the observed S/O versus O/H relation can be reproduced when the ejecta of very massive stars that go through the process of PISN are taken into account. Additionally, a bimodal top-heavy IMF and an initial strong burst of star formation are required to reach the reported high S/O values.
Conclusions. We show that the role of very massive stars going through the process of PISN should be taken into account to explain the chemical enrichment of sulphur and oxygen in metal-poor star-forming regions.
Key words: stars: massive / stars: Population II / stars: Population III / Galaxy: abundances / galaxies: starburst / galaxies: luminosity function, mass function
© The Authors 2024
 Open Access article, published by EDP Sciences, under the terms of the Creative Commons Attribution License (https://creativecommons.org/licenses/by/4.0), which permits unrestricted use, distribution, and reproduction in any medium, provided the original work is properly cited.
This article is published in open access under the Subscribe to Open model. This email address is being protected from spambots. You need JavaScript enabled to view it. to support open access publication.
1. Introduction
Sulfur (S) is produced in massive stars when helium is fused into heavier elements, including S, during the final stages in the life of the star, before the supernova explosion. An oxygen (O) convective core is formed during the hydrostatic burning of neon, which leads to the formation of α-elements until S. Sulfur is additionally produced during explosive O burning during the supernova (type II) explosion. Since oxygen is produced through the same processes, the study of the S/O ratio can give valuable indications on the chemical evolution, star formation history, and initial mass function (IMF). The sulfur and oxygen abundances have been derived and studied in several studies in the context of star-forming galaxies and giant H II regions (e.g. Pagel 1978; Vilchez et al. 1988; Garnett et al. 1997; Pérez-Montero et al. 2006; López-Sánchez & Esteban 2009; Berg et al. 2013; Dors et al. 2016; Fernández et al. 2019; Arellano-Córdova et al. 2020; Dors et al. 2023). However, the debate continues today regarding the S/O relation with metallicity, which is usually measured in terms of (O/H). Several studies (Garnett et al. 1997; Izotov et al. 2006; Guseva et al. 2011; Berg et al. 2020; Rogers et al. 2021) have shown that the S/O ratio remains constant with metallicity as traced by O/H. Since sulfur and oxygen are produced through the same processes as described above, their ratio is expected to be constant as long as they are produced in similar mass ranges of the stars. In contrast, some studies have pointed out that S/O might vary with decreasing metallicity (e.g. Vilchez et al. 1988; Dors et al. 2016; Díaz & Zamora 2022). Recently, Díaz & Zamora (2022) measured sulfur and oxygen abundances in a large sample of galaxies dominated by young, massive stars, finding a clear bimodality in the trend of the S/O ratio with metallicity. In their sample, the HII regions in compact dwarf galaxies (HII Gal) that are dominated by strong starbursts show S/O ratios that lie mostly below or around solar S/O, and an increasing trend of the S/O ratio with increasing metallicity (O/H). In contrast, giant diffuse HII regions (DHR), which lie mostly in irregular and spiral galaxies, exhibit the opposite trend, with high S/O ratios at low metallicities and a decreasing S/O ratio at increasing O/H. The most peculiar aspect is the extremely high S/O ratio observed in DHRs at low metallicities (12 + log(O/H) ∼ 7.0), for which a theoretical explanation is still lacking.
Similarly, high Fe/O ratios at low 12 + log(O/H) values have recently been reported in extremely metal-poor star-forming dwarf galaxies (with 12 + log(O/H) ≤ 7.69; Kojima et al. 2020). The high Fe/O ratios observed in these metal-poor galaxies were explained by Goswami et al. (2022) in their chemical evolution models by considering very massive stars that undergo processes such as pulsational PISN (PPISN/PISN) through their later evolutionary stages. Sulfur is produced through PISN, which occurs in very massive stars, with initial masses greater than about 130 M⊙. The PISN stage strongly depends on the mass of the He core at the end of the H-burning phase (Heger & Woosley 2002; Takahashi et al. 2018), which produces large amounts of elements such as Fe, S, and O. Takahashi et al. (2018) obtained new yields from PISN nucleosynthesis for rotating and non-rotating zero-metallicity stars. They compared their theoretical models with the abundances of metal-poor stars from the Stellar Abundances for Galactic Archeology (SAGA) database, but found no evidence of PISN metal-poor stars in the sample based on [Na/Mg] and [Ca/Mg] abundances. Since then, multiple observations have shown high Fe/O ratios (Kojima et al. 2020) and low [Mg/Fe] ratios (Yoshii et al. 2022), both of which have been linked to evidence of PISN nucleosynthesis enrichment. Additionally, Xing et al. (2023) reported abundances in very metal-poor (VMP) stars with extremely low sodium and cobalt abundances, which provide a chemical signature of PISN. One of the main difficulties in obtaining a direct signature is that PISN explosions do not leave behind any remnants, as core-collapse SN (CCSN) does, and hence the tracers of these explosions can only be found indirectly. Chemical abundances of various elements, if available, can provide us with crucial information that may allow us to distinguish between multiple possible nucleosynthesis channels, such as hypernovae (HNe), depending on which elements are produced. PISN yields have been used as a possible channel in previous studies to analyse the chemical evolution of different galaxies (Isobe et al. 2022; Watanabe et al. 2024). It has been shown that this stage is expected to be limited up to a threshold metallicity of Zcr ≲ 10−4 Z⊙ or Zcr ≲ 10−2 Z⊙ depending on efficient or inefficient dust cooling, respectively (Schneider et al. 2006; Salvadori et al. 2008). However, with current models, the PISN stage is suggested to be important until Z ∼ 0.5 Z⊙ (Kozyreva et al. 2014; Langer 2012; Costa et al. 2021).
Observationally, the VLT Tarantula Survey (Schneider et al. 2006), which studies the 30 Doradus region in the Large Magellanic Cloud (LMC), inferred very young (1−6 Myr) stars with masses of up to 200 M⊙. Additionally, Crowther et al. (2016) estimated star masses that could be as high as 300 M⊙ in the same region. Moreover, the IMF derived in specific regions of NGC 2070 shows an upper-mass slope of x = 0.65 and an overall slope of x = 0.9. In order to investigate the high S/O ratio observed in some metal-poor star-forming galaxies, we computed new chemical evolution models for these objects, including the PISN yields. A comparison of these models with observations can thus provide valuable information, firstly, concerning the nature of the chemical enrichment process at very low metallicity, which is especially interesting for the evolution of galaxies in the early Universe, and secondly, on the nature of the IMF and its possible deviations from universality.
In summary, the study of sulfur is highly relevant in the regions hosting very massive star formation. It is especially significant for the studies of galaxies in the early Universe. Its unique nucleosynthesis history and the new data coming from the James Webb Space Telescope (JWST) for low-metallicity galaxies can allow us to understand the viable role played by very massive stars in the chemical evolution of galaxies, and it might eventually help us decipher the properties of the first stars. Thus, the primary goal of this work is to study whether accounting for the PISN stage of very massive stars in chemical evolution modelling could be a possible channel to replicate the unusually high observed S/O ratios, as shown by the DHR sample of Díaz & Zamora (2022) at very low metallicity (12 + log(O/H) ⪅ 7.5). As previously mentioned, PISN are primarily thought to occur in low-metallicity environments, where high S/O ratios have been observed. Combined with the fact that PISNs produce a large amount of S, this study of the sulphur abundance at low metallicities can offer us a unique tracer for reconstructing the nucleosynthesis history of the early Universe and to comprehend the characteristics of its very massive stars.
This paper is structured as follows. In Sect. 2, we describe the chemical evolution model. In particular, we describe the PISN yields of oxygen, sulfur, and iron. In Sect. 3, we present the sample of observational data we analysed. In Sect. 4, we compare the observations to the predictions of the most suitable chemical evolution models and highlight the derived evolutionary constraints. Finally, in Sect. 5, we summarise our conclusions and outlook.
2. Method
In this section, we describe the chemical evolution model we developed to be used as a tool for understanding the high S/O ratios at low metallicity, as shown by recent studies. We used the code CHE-EVO (Silva et al. 1998), which computes one-zone open chemical evolution models considering the time evolution of the gas elemental abundances and includes the infall of primordial gas. This code has been used in several contexts to provide the input star formation and metallicity histories with the aim of interpreting the spectrophotometric evolution of both normal and starburst galaxies (e.g. Vega et al. 2008; Fontanot et al. 2009; Silva et al. 2011; Lo Faro et al. 2013, 2015; Hunt et al. 2019). The basic equation used in this code are written as follows:
 (1)
(1)
where for the element j, the first term on the right,  , corresponds to the infall rate of pristine material.
  represents the rate of gas consumption by star formation, and
  refers to the rate of gas return to the interstellar medium (ISM) by dying stars. The latter term also includes the contribution of type Ia supernovae (SNIa), whose rate is adjusted with the parameter ASNIa, which corresponds to the fraction of binaries with system masses between 3 M⊙ and 16 M⊙ and suitable properties to give rise to SNIa (Matteucci & Greggio 1986).
We used the Schmidt–Kennicutt law (Kennicutt 1998) to model the star formation rate (SFR),
 (2)
(2)
where ν is the efficiency of star formation, Mg is the mass of the gas, and k is the exponent of the star formation law. The gas infall law is assumed to be exponential (e.g. Grisoni et al. 2017, 2018), with an e-folding timescale of τinf. The IMF can be written as follows:
 (3)
(3)
2.1. Stellar yields
We used the same stellar yield compilation as in Goswami et al. (2022). We give a brief overview here and refer to the previous work for a more thorough review. For low- and intermediate-mass stars (Mi < 8 M⊙), single stars and binary systems that give rise to SNe Ia are characterized by different yields (Matteucci & Greggio 1986).
For single stars with initial masses Mi < 6 M⊙, we adopted the yields from calibrated asymptotic giant branch (AGB) models by Marigo et al. (2020). For 6 M⊙ < Mi < 8 M⊙, we used super-AGB yields from Ritter et al. (2018). For SNIa, we considered the yields provided by Iwamoto et al. (1999). For 8 M⊙ ≤ Mi ≤ 350 M⊙, we adopted the yield compilation by Goswami et al. (2022) for massive stars and very massive objects (VMO).
A comparison of PISN ejecta with other models in the literature is shown in Fig. 1. PISN model predictions from Goswami et al. (2022) are shown which include rotation. These ejecta were computed by matching the Heger & Woosley (2002) models, which originally do not include rotation, with the corresponding PARSEC (Bressan et al. 2012; Costa et al. 2021) rotating models. The rotating and non-rotating models from Takahashi et al. (2018) are shown for comparison. Finally, the rotation included CCSN yields derived by Limongi & Chieffi (2018) and used in Goswami et al. (2022) are also depicted. This allows us to explicitly display the difference in the production of the relevant elements through the two channels, that is, CCSN and PISN at low metallicities. The PISN yields in green and red show that the production of sulfur increases as the initial mass increases. As discussed in Sect. 1, the PISN yields strongly depend on the mass of the helium core. For the sake of simplicity, we still show the yields against the initial masses. This also allows us to simultaneously compare the PISN yields with the CCSN yields. The trend of an increased production is also true for iron, where stars with more massive initial masses (as a result of a more massive helium core) produce more iron. However, carbon and oxygen have the opposite trend, as the ejecta of both carbon and oxygen starts to decrease as the mass of the helium core increases. The effect of rotation is also more clearly visible in the case of carbon and oxygen, where the production of these elements grows with higher values of rotational velocities. Finally, rotation does not play an important role in the sulfur production. The comparison of the PISN yields to the CCSN yields for the same metallicity Zi = 0.0001 shows that there is relatively little sulfur and iron production through the CCSN channel at low metallicities. The production of carbon and oxygen is higher through the CCSN than for S and Fe. The relative difference between the CCSN and PISN yields for all four elements is significant in the low-metallicity regime, however.
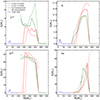 |
Fig. 1. Relation between newly produced ejecta (Ej) on the y-axis of the elements C12, O16, S, and Fe vs. the initial mass (Mi) on the x-axis from Z = 0.0001 rotational models of Goswami et al. (2022) in green (solid and dotted lines for two rotation rate values), based on Heger & Woosley (2002) pure He non-rotating models. The CCSN yields are shown in blue. The yields of rotating (solid) and non-rotating (dotted) models by Takahashi et al. (2018) for zero metallicity stars are shown in red. Since the actual S and Fe CCSN yields are low, they are shown multiplied by a factor of 15 for clarity. |
To illustrate this better, we show in Fig. 2 the IMF-averaged S/O and Fe/O ratios for the CCSN and PISN yields used in this work. We present the element ratios for two distinct IMFs to demonstrate that based on CCSN yields and a canonical IMF alone, the obtained S/O and Fe/O ratios are not as high as they would be if PISN were also considered. The top panel of Fig. 2 shows the element ratios averaged over the IMF obtained from the CCSN and PISN yields using a top-heavy IMF with an upper-mass limit of 300 M⊙ and a slope of xUP = 0.6. Since it has a high upper mass limit and the stepper slope of the IMF increases the number of such very massive stars. The PISN stage, due to explosive O burning, produces higher amounts of S and Fe that are taken into account, which causes the S/O and Fe/O ratios to be high. The O production is lower in the high-mass PISN regime than in low-mass PISN because O is fused to other heavier elements. In the bottom panel, the element ratios averaged over a canonical Kroupa IMF with an upper mass limit of MUP = 100 M⊙ are shown. Because of the upper-mass cut, the very massive stars going through the PISN stage are not accounted for, so the contribution of these ratios primarily comes from CCSN yields, and therefore, the two bars match.
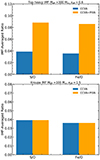 |
Fig. 2. IMF-averaged ratios of S/O and Fe/O shown for two IMFs: a top-heavy IMF with a 300 M⊙ upper-mass limit (PISN stage is accounted for), and a canonical Kroupa IMF with a 100 M⊙ limit for the yields adopted in this work. |
3. Observational data
The abundance data sample was taken from the extensive work by Izotov et al. (2006) and Díaz & Zamora (2022), together with a selection of H II regions from Yates et al. (2020). Izotov et al. (2006) examined the chemical composition of the emission line galaxies of the Sloan Digital Sky Survey (SDSS) Data Release 3. They measured the [SII]λλ6717,31 and [SIII]λ6312 lines1 of sulfur, and used the direct method for the derivation of sulfur and oxygen abundances. The sulfur abundances they derived in most of these galaxies exhibit a similar pattern to that obtained for nearby galaxies in the high-metallicity regime. At the low-metallicity end (12 + log(O/H) ⪅ 7.2), the S/O ratios derived exceed the canonical solar value (log(S/O) = −1.57; Asplund et al. 2009), however. Díaz & Zamora (2022) derived sulfur abundances for a large sample of HII regions in irregular and spiral galaxies in their innovative work, including the Magellanic Clouds (giant diffuse HII regions; DHR subsample) and dwarf galaxies with a prominent starburst (HII Gal subsample), using measurements of the [SII]λλ6717,31 and [SIII]λλ9069,9532 lines from the literature and recalculating the abundances following the direct method, based on the derivation of the electron temperature. Similarly, abundances derived with the direct method for a set of giant H II regions were also included from Yates et al. (2020), who also measured the [SII] and [SIII] lines. Peculiarly high ratios of S/O in the lowest metallicity range were found by Díaz & Zamora (2022) in their DHR sample. They were confirmed using the Yates et al. (2020) data. Both these samples follow a similar trend of high S/O ratios at low O/H and then a decrease in S/O with the increase in metallicity, with some dispersion at high O/H. However, in the HII Gal sample of Díaz & Zamora (2022) and in most of the Izotov et al. (2006) sample, the S/O ratios are at about the solar S/O value. In this work, we concentrate on the more anomalous high S/O ratios at low metallicities seen in the DHR sample of Díaz & Zamora (2022), for which there is currently no theoretical explanation. It is important to emphasize here that invoking a possible depletion of oxygen in dust grains (≈0.08 dex for this metallicity; Peimbert & Peimbert 2010) could not explain the observed trend, especially at such low abundance.
We note that the three abundance studies selected above independently reported high S/O values, regardless of the specific abundance derivation. Our models reproduce this for a number of star-forming objects at low metallicity. Performing a study for a larger complete sample with fully homogeneously derived sulfur abundances is beyond the scope of this work.
In Fig. 3 we show the log(S/O) ratio versus oxygen abundance, 12 + log(O/H). The red data points correspond to the sample from Izotov et al. (2006) while the brown and cyan points represent the abundances derived from Díaz & Zamora (2022) for the DHR and HII Gal samples, respectively, and the blue triangles correspond to star-forming regions from Yates et al. (2020). Figure 3 shows that as the O/H abundance decreases, the S/O ratio starts to increase in the DHR and the Yates et al. (2020) sample shown in the brown and blue points, respectively, and clearly deviates from the constant solar ratio suggested by various studies mentioned in Sect. 1. On the other hand, the data are more strongly dispersed around the solar S/O ratio for the HII Gal and most of the Izotov et al. (2006) sample, which are indicated by cyan and red dots, respectively. In the following section, we explore whether chemical evolution models that account for the PISN stage can replicate the high S/O ratios at low metallicity that are observed in the DHR sample.
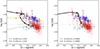 |
Fig. 3. S/O ratio for two different models with PISN: M5 (M5ω3 and M5ω4) in the left panel, and M6 (M6ω3 and M6ω4) in the right panel as a function of the oxygen abundance 12 + log(O/H). The dotted and solid black lines denote the two different values of the rotational parameters. The red points are adopted from Izotov et al. (2006), and the blue triangles are adopted from Yates et al. (2020). The brown and cyan points correspond to the DHR and HII Gal subsamples of Díaz & Zamora (2022), respectively. Model M1, the dashed grey line, is a chemical evolution model representative of the MW disc (Goswami et al. 2021), where the grey square corresponds to an age of 200 Myr, and the M3 model predictions are shown as the dash-dotted yellow line. The six squares in models M5 and M3 represent the model ages at 5, 15, 30, 60, 100, and 200 Myr. For M6, only ages corresponding to 5 and 15 Myr are shown by the two squares. The values adopted for the critical metallicity Zcr and rotational parameter Ω are quoted for the two models. The dot-dashed grey line denotes the solar S/O ratio. See the text and Table 1 for details. |
Chemical evolution and IMF parameters of the selected models.
4. Results
We used chemical evolution models to study the evolutionary constraints that can be derived from the chemical abundance observations. We investigated the high values of the S/O ratio and its trend with O/H that were observed at very low metallicity. We verified whether the observed S/O ratios, which do not follow the expected constant behaviour considering a similar nucleosynthetic origin for both S and O, could be explained from the point of view of stellar evolution. The peculiarly high S/O ratios seen at low metallicity (⪅0.1 Z⊙) show a different trend than for galaxies at high 12 + log(O/H), as presented in Fig. 3. To test this behaviour, we started by applying the base model M1, which was previously used by Goswami et al. (2021) to explain the data in the high-metallicity range following the chemical evolution pattern of the Milky Way (MW) disc and other local galaxies. Model M1 has a canonical Kroupa et al. (1993) IMF with an upper-mass limit of 100 M⊙, and it includes all the parameters required to reproduce the chemical evolution of the MW (Grisoni et al. 2017, 2018, 2019, 2020; Spitoni et al. 2021; Goswami et al. 2021). As illustrated in Fig. 3, model M1, shown as the dashed grey line, extends through the HII Gal sample and the majority of the Izotov sample with higher O/H, but is unable to reach the high S/O ratios shown by the DHR sample at low metallicities. Since the upper-mass limit of the IMF in this model is 100 M⊙, and as explained in Sect. 2, until this mass range, CCSN at low metallicities do not produce enough S to increase the S/O ratios, as shown in Fig. 1. Most of the points at high O/H resemble the abundances and ratios derived in local group galaxies, and our model appears to reproduce this part of the observations. We note that although the HII Gal sample includes galaxies with very young ages, this model, which does not include a starburst phase, reaches 12 + log(O/H) ∼ 7.5 at 200 Myr, as shown by the grey square. When this model is used with an appropriate SFH (e.g. an increased star formation efficiency) that is more suitable for starburst-dominated galaxies such as in the HII Gal and Izotov et al. (2006) samples, it can reproduce the cyan and red dots in Fig. 1 with the appropriate young ages expected for these galaxies. Nonetheless, this is not the goal of this work, and in any case, this reference model shows that with a canonical IMF and without the PISN contribution, the high S/O ratios observed in the DHR sample cannot be obtained.
A similar problem was recently studied by Goswami et al. (2022). They reproduced the peculiarly high Fe/O ratios from EMPGs. These EMPGs follow a decreasing trend of Fe/O with increasing metallicity. This trend was also observed for the DHR subsample S/O ratio, as shown in Fig. 3. These authors explained that the observed high Fe/O ratios and their decreasing trend with metallicity can only be reproduced by using a top-heavy IMF and taking the PISN stage in the chemical evolution modelling into account. On the other hand, we comment in Sect. 2 while comparing the shapes of PISN ejecta that S and Fe show very similar trends in their ejecta in a similar range of masses of stars going through the PISN stage. We therefore tested three models, M3, M5, and M6 (M5 and M6 with two different rotational parameters ω = Ω/Ωcrit = 0.3 and 0.4, respectively), which were used by Goswami et al. (2022) to reproduce the high Fe/O ratios and investigated whether these models can explain the high S/O as well. We show in Table 1 the characteristics of each model tested in this work and present them here in brief. We refer to Goswami et al. (2022) for a detailed description of these models. Model M3 uses a top-heavy IMF with a MUP = 300 M⊙ and a slope of xUP = 0.6. This model takes the PISN stage due to the high MUP into account, which causes the S/O ratio to grow due to the increased production of S in the low-metallicity region, as shown by the dash-dotted yellow line in Fig. 3. However, although the S/O ratio increases compared to the HII Gal sample and goes through the blue sample of Yates et al. (2020), this model cannot reproduce the highest observed S/O values (around 12 + log(O/H) ∼ 7.1; brown dots), which is the main purpose of this work. The age obtained by the model at 12 + log(O/H) ∼ 7.5 is 30 Myr, which is much younger than in M1 at the same metallicity. Although the HII Gal and DHR samples both include metal-poor and bursty star-forming regions, which in principle would be favourable locations for very massive star formation, there could be other reasons for the difference in S/O ratios at the low-metallicity end of the sample. The exact characteristics associated with the formation process of these extremely massive stars are still unknown, as are the environmental circumstances that led to their formation. One possible reason for the difference seen between the S/O ratios of HII Gal and DHR low-metallicity samples, which are thought likely for very massive star formation, might be the variations in the maximum mass limit of stars that form in different galaxies.
For instance, a star in the low-mass PISN regime in Fig. 1 with a mass of 150 M⊙ produces more O than S because the temperatures are not high enough to fuse heavier elements. This results in a lower S/O ratio. On the other hand, a star in the high-mass PISN regime, mass 250 M⊙, produces more S than it did previously, meaning that the S/O ratio would be higher. Moreover, Chruślińska et al. (2024) has demonstrated that distinct trends in the element ratios may be associated with specific SFR (sSFR). They discovered a distinct [O/Fe] ratio evolution with the sSFR, but the PISN did not account for this. These results would point towards a further enhancement of this dependence. Additionally, further study of these environments could yield significant information about characteristics other than low-metallicity and bursty star formation regions, which could be favourable to the creation of VMS. This will allow for more constraints on the formation of VMS and other nucleosynthesis channels. Nonetheless, with the constraints currently available for the abundance ratios, ages, and star formation characteristics, the PISN channel cannot be ruled out.
In models M5 and M6, a bimodal IMF was assumed to sample the effects of VMOs exploding as PISN. To do this in the chemical evolution model, an early phase with a top-heavy IMF, suitable for Population III-like stars (Wise et al. 2012), was used, which has the following form:
![Mathematical equation: $$ \begin{aligned} \phi (M_{\rm i}) = \frac{\mathrm{d}n}{\mathrm{d}\log (M_{\rm i})} \propto M_{\rm i}^{-1.3} \times \exp \left[-\left(\frac{M_{\mathrm{char} }}{M_{\rm i}}\right)^{1.6}\right]. \end{aligned} $$](/articles/aa/full_html/2024/05/aa48231-23/aa48231-23-eq7.gif) (4)
(4)
An Mchar of 200 M⊙ was adopted for this IMF instead of Mchar of 40 M⊙ used in the original work since the ejecta of S and O increase strongly with the initial masses in the high-mass range, as shown in Sect. 1. We also checked with Mchar of 300 M⊙, and since the results were similar to Mchar = 200 M⊙, we only show one case here. The PISN enrichment phase is limited to the early evolution of the starburst, the duration of which is constrained by the critical metallicity, Zcr. When this gas metallicity is reached, a Kroupa IMF (Eq. (3)) with xUP = 1.3 and MUP = 40 M⊙ is adopted. Because higher mass-loss rates cause stars to be unable to reach high enough masses to enter the PISN regime as the metallicity grows, an IMF change with a lower MUP was adopted. The critical metallicity is Zcr = 10−2 for M5 (M5ω3 and M5ω4) and Zcr = 10−4 for M6 (M6ω3 and M6ω4) depending on whether dust cooling is efficient or not (Schneider et al. 2006; Salvadori et al. 2008). To model the star formation, a star formation efficiency of ν = 1 Gyr−1 was adopted for M5. In the left panel of Fig. 3, model M5 is shown as dotted (M5ω3) and dashed black lines (M5ω4) for two different rotation values considered for the PISN yields. This model reaches the highest S/O ratios at about 15 Myr, and to be consistent with the young ages of these galaxies, these models are shown until 200 Myr of their evolution, unlike models M1 and M3, whose entire evolution (13 Gyr) is shown.
The model can reach the high S/O ratios at lower 12 + (O/H), where an initial burst is modelled that takes the presence of VMOs into account; when the critical metallicity is reached (and the effect of VMO enrichment ceases and the IMF is switched to Kroupa et al. (1993), it results in the decreasing S/O ratio present in the observations. The model starts with a metal-free gas, Z = 10−10, and as the VMOs start to explode, the metallicity rapidly increases and reaches the Zcr value in a short period (see Fig. 4 of Goswami et al. 2022). During this phase, the PISN contributes to the increased sulfur production, and due to this, the model can reach high S/O ratios. When the Zcr is reached, the IMF changes to a Kroupa-like IMF, in which stars are only formed until Mi ≤ 40 M⊙. This causes the S/O ratio to decrease with increasing metallicity, but the model does not go through the DHR sample points shown in brown at higher metallicities and results in slightly higher ages, as expected from regions dominated by very massive stars, as shown by Schneider et al. (2006).
In order to explain this decreasing trend of the DHR sample as the metallicity increases while being consistent with younger ages, we used Model M6, which was modelled with two different rotational parameters (ω = 0.3, 0.4) and a more efficient star formation. It is shown in the right panel of Fig. 3 as dotted (M6ω3) and solid black lines (M6ω4). This model matches not only the highest S/O ratio shown by the DHR sample at low O/H, but also shows the decline in the S/O ratio at higher metallicities, although with a steeper slope. To reproduce this decline in S/O, we adopted this model, which takes into account the stars that overproduce oxygen or underproduce sulfur when it reaches the Zcr, as shown by the S/O ratio of the DHR data in the high-metallicity regime. When the critical metallicity was reached, a Kroupa IMF with MUP = 150 M⊙ was used. In this mass range, stars produce more oxygen than sulfur, which causes the S/O ratio to decrease. Therefore, we showed that by adopting an initial burst of VMOs and using a bimodal IMF, the high S/O ratios of the DHR subsample and then the decline with increasing metallicity observed can be explained. Because this model uses a higher star formation efficiency of ν = 5 Gyr−1 combined with a top-heavy IMF, the ages obtained at the same metallicity compared to model M5 are younger. The two black squares correspond to ages 5 and 15 Myr, and this model reaches the highest S/O ratios before 5 Myr, which is consistent with the ages derived from regions in the Magellanic Clouds hosting very massive stars (Schneider et al. 2006; Crowther et al. 2016). We thus demonstrated that a scenario that includes PISN in the models might explain these high S/O ratios. Díaz & Zamora (2022) suggested in their comprehensive and inspiring work that the decline in the S/O ratio with increasing metallicity might be related to the chemical evolution of massive star nucleosynthesis, which produces more sulfur, entwined with variations in the IMF, which we have investigated through this model. The authors also commented that sulfur production from SNe Ia is insufficient to produce the desired slope for the S/O decline (Weinberg et al. 2019). We note that to model the exact slope of the decline using the two datasets shown in the DHR sample of Díaz & Zamora (2022) and Yates et al. (2020), a homogeneous derivation of the S/O abundances between the samples is required, as are more data, especially for the low-metallicity regions. This would be the aim of a future study. This would allow us to obtain a constraint on the shape of the bimodal IMF when Zcr is reached.
5. Conclusions and outlook
We used chemical evolution models to analyse the observed sulfur and oxygen abundances derived in large samples of star-forming galaxies, which indicate higher S/O ratios at low metallicities that deviate from the constant solar S/O ratio suggested by other works. To do this, we used chemical evolution models as a tool for investigating which evolutionary scenario can explain these high S/O ratios.
Similar peculiarly high Fe/O ratios at low metallicities have been reported for EMPGs (e.g. Kojima et al. 2020; Izotov et al. 2006). Goswami et al. (2022) reproduced these high Fe/O ratios taking the later evolutionary stages of massive stars into account, such as PISN and PPISN in the chemical evolution modelling. We compared the stellar yields of S and Fe in the VMO mass range from the yield set used in their work. In Fig. 1 we show that the yields of S and Fe follow a similar trend in this mass range, where VMOs go through the PPISN/PISN process. We also showed that at low metallicities, the sulfur and oxygen production through the CCSN channel is significantly lower than the PISN channel. Additionally, in Fig. 2, we showed the IMF-averaged ratios of S/O and Fe/O obtained for two different IMFs to show the differences between CCSN production alone and including PISN channels. We thus used the models that reproduce the observed high Fe/O ratio of these galaxies to test whether when these later evolutionary stages are considered as a possible channel, the high S/O ratios shown by the DHR subsample can be explained simultaneously as well. Firstly, we showed that using model M1, which was previously applied to reproduce the MW disc with a canonical IMF, the high S/O ratio at low metallicities cannot be reproduced. This model does not take the PISN stage into account and has an upper-mass limit of MUP = 100 M⊙ does not produce enough sulfur through the CCSN channel at low metallicities to obtain a high S/O ratio. It can explain the S/O ratios shown by the HII Gal and Izotov samples derived at higher 12 + (O/H), however, but with an older age because in this metallicity range, the data appear to follow the trend of the local galaxies.
Thereafter, we used models that take stars into account that go through the PISN stage. Model M3 used a top-heavy IMF with a higher MUP of 300 M⊙ and a slope of xUP = 0.6, which increased the S/O ratios at lower metallicities so that they go through the Yates et al. (2020) sample, but they are not increased enough to reach the highest S/O values observed in the DHR sample of Díaz & Zamora (2022). Subsequently, to properly account for the PISN evolutionary stage and reach the high S/O ratios, we used a bimodal IMF, the first part of which took an IMF devised for Population III-like stars into account (Wise et al. 2012), with a burst that included the effects of VMOs. We limited this early phase using a critical metallicity, Zcr because VMOs only form in low-metallicity environments, according to theoretical predictions. When this Zcr was reached, a canonical Kroupa et al. (1993) IMF was adopted. The values of Zcr used here are Zcr = 0.0001 and 0.01, depending on inefficient or efficient dust cooling (Schneider et al. 2006; Salvadori et al. 2008). In Fig. 3, we showed that model M5 at low metallicity can reach the high S/O values, as indicated in the DHR sample. In this model, the early phase takes into account a strong burst, for which a star formation efficiency of ν = 1 Gyr−1 was used to reach a high S/O ratio at young ages. During the PISN stage, the sulfur production is higher than the oxygen production in the high-mass PISN regime. Hence, a high S/O ratio can be obtained. When the critical metallicity is reached, VMOs are no longer formed, leading to a reduction in sulfur production. The decreasing trend of S/O shown by the data is reproduced by the model as well, although with a different slope. The effect of rotation on the production of sulfur is minimal, as shown in Fig. 3, where the two models with different rotational (Ω) values follow roughly the same path.
Model M5 goes through the highest S/O ratios at low metallicity, but does not go through the DHR sample as the metallicity increases. Combined with slightly higher ages than expected from regions hosting very massive stars, we therefore used model M6, which has a higher star formation efficiency of ν = 5 Gyr−1, to be able to reach the high S/O ratio at a very young age, consistent with previous studies. Model M6, like M5, can reach a high S/O ratio at low metallicity because of the increased production of sulfur from the PISN stage. The decreasing trend of the S/O starts when the model reaches Zcr. In this case, because of the higher efficiency in star formation and because it is populated with more stars that produce more oxygen than sulfur using an appropriate IMF, for which a second Kroupa et al. (1993) IMF with an MUP = 150 M⊙ and xUP = 0.9 has been adopted, the observed decrease in S/O is also shown by the model with a steeper slope than observed. In order to accurately replicate the slope, more low-metallicity data demonstrating these high S/O ratios would need to be obtained, along with a uniform derivation of the S/O ratios of the two samples of DHR and Yates et al. (2020). This would be the aim of a subsequent study, and in this instance, we offer the theoretical scenario of this decline.
Hence, we showed that by taking into account later evolutionary stages such as those of the PPISN/PISN process, and adopting an IMF that is somewhat more suitable for star formation events than those recently studied in the early Universe, the observed high S/O ratios at low metallicity can be reproduced. A top-heavy IMF like this with MUP of 200 M⊙ as reported for 30 Doradus, and in general, in other bursty star-forming regions, has been predicted, which favours the formation of these very massive stars (Marks et al. 2012; Jeřábková et al. 2018; Zhang et al. 2018; Crowther et al. 2010; Schneider et al. 2018). This shows that PISN provide a possible channel for obtaining high S/O ratios in low-metallicity star-forming objects.
However, due to the lack of accurate derivations of sulfur abundances in the low-metallicity range, the IMF slope and the upper mass limit are difficult to constrain robustly. Such consistent accurate derivations of sulfur will also allow us to find models that fit these datasets better, which is the purpose of a future study, as discussed before. To elucidate the characteristics of this intriguing scenario of chemical enrichment from very massive stars, additional observations and an analysis of other elemental abundance ratios are required. Moreover, this would enable us to distinguish between various possible nucleosynthesis channels. With more data coming from JWST to derive the chemical abundances, including those of sulfur, of young star-forming galaxies, we could try to constrain the early chemical enrichment scenario in a more robust way.
We have shown that with the study of the chemical abundance and the S/O ratio of star-forming galaxies, important properties such as the mass limit of the very massive stars can be better constrained theoretically. This might help to constrain the upper-mass limit and tail of the IMF in the early Universe. Similarly, the high Fe/O ratios that were observed in these galaxies at low metallicity have recently been explained by theoretical models that included the PISN stage (Goswami et al. 2022). However, the iron lines are typically faint or undetectable in this class of objects, whereas sulfur lines are frequently seen in their spectra even in high-redshift galaxies. In addition, sulfur, unlike iron, does not suffer high depletion in dust grains. To this end, we encourage JWST observations of the IR emission lines of sulfur ([SIII], [SIV]) and neon ([NeII], [NeIII]), which are visible in the spectra of star-forming objects, in order to consistently derive S/Ne as a possible proxy for S/O. We also propose that the derivation of sulfur abundances and S/O ratios of more distant star-forming galaxies (e.g. with JWST given its spectroscopy performance and timing of data gathering) could pave a new, unexplored path to understanding the role of very massive stars in the early stages of galaxy formation.
From S+ and S++ ions, which typically represent common and abundant ionic species of sulfur in star-forming regions.
Acknowledgments
S.G. acknowledges financial support from the European Union under the 2014–2020 ERDF Operational Programme and by the Department of Economic Transformation, Industry, Knowledge, and Universities of the Regional Government of Andalusia through the FEDER-UCA18-107404 grant. S.G. acknowledges funding from Project CRISP PTDC/FIS-AST-31546/2017 funded by FCT. J.V.M., B.P.D., E.P.M. acknowledge financial support from grants CEX2021-001131-S and PID2019-107408GB-C44 funded by MCIN/AEI/10.13039/501100011033.
References
- Arellano-Córdova, K. Z., Esteban, C., García-Rojas, J., & Méndez-Delgado, J. E. 2020, MNRAS, 496, 1051 [Google Scholar]
- Asplund, M., Grevesse, N., Sauval, A. J., & Scott, P. 2009, ARA&A, 47, 481 [NASA ADS] [CrossRef] [Google Scholar]
- Berg, D. A., Skillman, E. D., Garnett, D. R., et al. 2013, ApJ, 775, 128 [NASA ADS] [CrossRef] [Google Scholar]
- Berg, D. A., Pogge, R. W., Skillman, E. D., et al. 2020, ApJ, 893, 96 [NASA ADS] [CrossRef] [Google Scholar]
- Bressan, A., Marigo, P., Girardi, L., et al. 2012, MNRAS, 427, 127 [NASA ADS] [CrossRef] [Google Scholar]
- Chruślińska, M., Pakmor, R., Matthee, J., & Matsuno, T. 2024, A&A, in press, https://doi.org/10.1051/0004-6361/202347602 [NASA ADS] [CrossRef] [EDP Sciences] [Google Scholar]
- Costa, G., Bressan, A., Mapelli, M., et al. 2021, MNRAS, 501, 4514 [NASA ADS] [CrossRef] [Google Scholar]
- Crowther, P. A., Schnurr, O., Hirschi, R., et al. 2010, MNRAS, 408, 731 [Google Scholar]
- Crowther, P. A., Caballero-Nieves, S. M., Bostroem, K. A., et al. 2016, MNRAS, 458, 624 [Google Scholar]
- Díaz, Á. I., & Zamora, S. 2022, MNRAS, 511, 4377 [CrossRef] [Google Scholar]
- Dors, O. L., Pérez-Montero, E., Hägele, G. F., Cardaci, M. V., & Krabbe, A. C. 2016, MNRAS, 456, 4407 [NASA ADS] [CrossRef] [Google Scholar]
- Dors, O. L., Valerdi, M., Riffel, R. A., et al. 2023, MNRAS, 521, 1969 [NASA ADS] [CrossRef] [Google Scholar]
- Fernández, V., Terlevich, E., Díaz, A. I., & Terlevich, R. 2019, MNRAS, 487, 3221 [CrossRef] [Google Scholar]
- Fontanot, F., Somerville, R. S., Silva, L., Monaco, P., & Skibba, R. 2009, MNRAS, 392, 553 [NASA ADS] [CrossRef] [Google Scholar]
- Garnett, D. R., Shields, G. A., Skillman, E. D., Sagan, S. P., & Dufour, R. J. 1997, ApJ, 489, 63 [NASA ADS] [CrossRef] [Google Scholar]
- Goswami, S., Slemer, A., Marigo, P., et al. 2021, A&A, 650, A203 [NASA ADS] [CrossRef] [EDP Sciences] [Google Scholar]
- Goswami, S., Silva, L., Bressan, A., et al. 2022, A&A, 663, A1 [NASA ADS] [CrossRef] [EDP Sciences] [Google Scholar]
- Grisoni, V., Spitoni, E., Matteucci, F., et al. 2017, MNRAS, 472, 3637 [Google Scholar]
- Grisoni, V., Spitoni, E., & Matteucci, F. 2018, MNRAS, 481, 2570 [NASA ADS] [Google Scholar]
- Grisoni, V., Matteucci, F., Romano, D., & Fu, X. 2019, MNRAS, 489, 3539 [NASA ADS] [CrossRef] [Google Scholar]
- Grisoni, V., Cescutti, G., Matteucci, F., et al. 2020, MNRAS, 492, 2828 [Google Scholar]
- Guseva, N. G., Izotov, Y. I., Stasińska, G., et al. 2011, A&A, 529, A149 [NASA ADS] [CrossRef] [EDP Sciences] [Google Scholar]
- Heger, A., & Woosley, S. E. 2002, ApJ, 567, 532 [Google Scholar]
- Hunt, L. K., De Looze, I., Boquien, M., et al. 2019, A&A, 621, A51 [NASA ADS] [CrossRef] [EDP Sciences] [Google Scholar]
- Isobe, Y., Ouchi, M., Suzuki, A., et al. 2022, ApJ, 925, 111 [NASA ADS] [CrossRef] [Google Scholar]
- Iwamoto, K., Brachwitz, F., Nomoto, K., et al. 1999, ApJS, 125, 439 [NASA ADS] [CrossRef] [Google Scholar]
- Izotov, Y. I., Stasińska, G., Meynet, G., Guseva, N. G., & Thuan, T. X. 2006, A&A, 448, 955 [CrossRef] [EDP Sciences] [Google Scholar]
- Jeřábková, T., Hasani Zonoozi, A., Kroupa, P., et al. 2018, A&A, 620, A39 [Google Scholar]
- Kennicutt, R. C., Jr. 1998, ApJ, 498, 541 [Google Scholar]
- Kojima, T., Ouchi, M., Rauch, M., et al. 2020, ApJ, 898, 142 [NASA ADS] [CrossRef] [Google Scholar]
- Kozyreva, A., Yoon, S.-C., & Langer, N. 2014, A&A, 566, A146 [NASA ADS] [CrossRef] [EDP Sciences] [Google Scholar]
- Kroupa, P., Tout, C. A., & Gilmore, G. 1993, MNRAS, 262, 545 [NASA ADS] [CrossRef] [Google Scholar]
- Langer, N. 2012, ARA&A, 50, 107 [CrossRef] [Google Scholar]
- Limongi, M., & Chieffi, A. 2018, VizieR Online Data Catalog: J/ApJS/237/13 [Google Scholar]
- Lo Faro, B., Franceschini, A., Vaccari, M., et al. 2013, ApJ, 762, 108 [NASA ADS] [CrossRef] [Google Scholar]
- Lo Faro, B., Silva, L., Franceschini, A., Miller, N., & Efstathiou, A. 2015, MNRAS, 447, 3442 [NASA ADS] [CrossRef] [Google Scholar]
- López-Sánchez, A. R., & Esteban, C. 2009, A&A, 508, 615 [NASA ADS] [CrossRef] [EDP Sciences] [Google Scholar]
- Marigo, P., Cummings, J. D., Curtis, J. L., et al. 2020, Nat. Astron., 4, 1102 [NASA ADS] [CrossRef] [Google Scholar]
- Marks, M., Kroupa, P., Dabringhausen, J., & Pawlowski, M. S. 2012, MNRAS, 422, 2246 [NASA ADS] [CrossRef] [Google Scholar]
- Matteucci, F., & Greggio, L. 1986, A&A, 154, 279 [NASA ADS] [Google Scholar]
- Pagel, B. E. J. 1978, MNRAS, 183, 1P [NASA ADS] [CrossRef] [Google Scholar]
- Peimbert, A., & Peimbert, M. 2010, ApJ, 724, 791 [NASA ADS] [CrossRef] [Google Scholar]
- Pérez-Montero, E., Díaz, A. I., Vílchez, J. M., & Kehrig, C. 2006, A&A, 449, 193 [NASA ADS] [CrossRef] [EDP Sciences] [Google Scholar]
- Ritter, C., Herwig, F., Jones, S., et al. 2018, MNRAS, 480, 538 [NASA ADS] [CrossRef] [Google Scholar]
- Rogers, N. S. J., Skillman, E. D., Pogge, R. W., et al. 2021, ApJ, 915, 21 [NASA ADS] [CrossRef] [Google Scholar]
- Salvadori, S., Ferrara, A., & Schneider, R. 2008, MNRAS, 386, 348 [Google Scholar]
- Schneider, R., Omukai, K., Inoue, A. K., & Ferrara, A. 2006, MNRAS, 369, 1437 [NASA ADS] [CrossRef] [Google Scholar]
- Schneider, F. R. N., Sana, H., Evans, C. J., et al. 2018, Science, 359, 69 [NASA ADS] [CrossRef] [Google Scholar]
- Silva, L., Granato, G. L., Bressan, A., & Danese, L. 1998, ApJ, 509, 103 [Google Scholar]
- Silva, L., Schurer, A., Granato, G. L., et al. 2011, MNRAS, 410, 2043 [NASA ADS] [Google Scholar]
- Spitoni, E., Verma, K., Silva Aguirre, V., et al. 2021, A&A, 647, A73 [EDP Sciences] [Google Scholar]
- Takahashi, K., Yoshida, T., & Umeda, H. 2018, ApJ, 857, 111 [NASA ADS] [CrossRef] [Google Scholar]
- Vega, O., Clemens, M. S., Bressan, A., et al. 2008, A&A, 484, 631 [NASA ADS] [CrossRef] [EDP Sciences] [Google Scholar]
- Vilchez, J. M., Pagel, B. E. J., Diaz, A. I., Terlevich, E., & Edmunds, M. G. 1988, MNRAS, 235, 633 [CrossRef] [Google Scholar]
- Watanabe, K., Ouchi, M., Nakajima, K., et al. 2024, ApJ, 962, 50 [NASA ADS] [CrossRef] [Google Scholar]
- Weinberg, D. H., Holtzman, J. A., Hasselquist, S., et al. 2019, ApJ, 874, 102 [NASA ADS] [CrossRef] [Google Scholar]
- Wise, J. H., Abel, T., Turk, M. J., Norman, M. L., & Smith, B. D. 2012, MNRAS, 427, 311 [NASA ADS] [CrossRef] [Google Scholar]
- Xing, Q.-F., Zhao, G., Liu, Z.-W., et al. 2023, Nature, 618, 712 [NASA ADS] [CrossRef] [Google Scholar]
- Yates, R. M., Schady, P., Chen, T. W., Schweyer, T., & Wiseman, P. 2020, A&A, 634, A107 [NASA ADS] [CrossRef] [EDP Sciences] [Google Scholar]
- Yoshii, Y., Sameshima, H., Tsujimoto, T., et al. 2022, ApJ, 937, 61 [NASA ADS] [CrossRef] [Google Scholar]
- Zhang, Z.-Y., Romano, D., Ivison, R. J., Papadopoulos, P. P., & Matteucci, F. 2018, Nature, 558, 260 [Google Scholar]
All Tables
All Figures
|
Fig. 1. Relation between newly produced ejecta (Ej) on the y-axis of the elements C12, O16, S, and Fe vs. the initial mass (Mi) on the x-axis from Z = 0.0001 rotational models of Goswami et al. (2022) in green (solid and dotted lines for two rotation rate values), based on Heger & Woosley (2002) pure He non-rotating models. The CCSN yields are shown in blue. The yields of rotating (solid) and non-rotating (dotted) models by Takahashi et al. (2018) for zero metallicity stars are shown in red. Since the actual S and Fe CCSN yields are low, they are shown multiplied by a factor of 15 for clarity. |
| In the text | |
|
Fig. 2. IMF-averaged ratios of S/O and Fe/O shown for two IMFs: a top-heavy IMF with a 300 M⊙ upper-mass limit (PISN stage is accounted for), and a canonical Kroupa IMF with a 100 M⊙ limit for the yields adopted in this work. |
| In the text | |
|
Fig. 3. S/O ratio for two different models with PISN: M5 (M5ω3 and M5ω4) in the left panel, and M6 (M6ω3 and M6ω4) in the right panel as a function of the oxygen abundance 12 + log(O/H). The dotted and solid black lines denote the two different values of the rotational parameters. The red points are adopted from Izotov et al. (2006), and the blue triangles are adopted from Yates et al. (2020). The brown and cyan points correspond to the DHR and HII Gal subsamples of Díaz & Zamora (2022), respectively. Model M1, the dashed grey line, is a chemical evolution model representative of the MW disc (Goswami et al. 2021), where the grey square corresponds to an age of 200 Myr, and the M3 model predictions are shown as the dash-dotted yellow line. The six squares in models M5 and M3 represent the model ages at 5, 15, 30, 60, 100, and 200 Myr. For M6, only ages corresponding to 5 and 15 Myr are shown by the two squares. The values adopted for the critical metallicity Zcr and rotational parameter Ω are quoted for the two models. The dot-dashed grey line denotes the solar S/O ratio. See the text and Table 1 for details. |
| In the text | |
Current usage metrics show cumulative count of Article Views (full-text article views including HTML views, PDF and ePub downloads, according to the available data) and Abstracts Views on Vision4Press platform.
Data correspond to usage on the plateform after 2015. The current usage metrics is available 48-96 hours after online publication and is updated daily on week days.
Initial download of the metrics may take a while.