Fig. 3.
Download original image
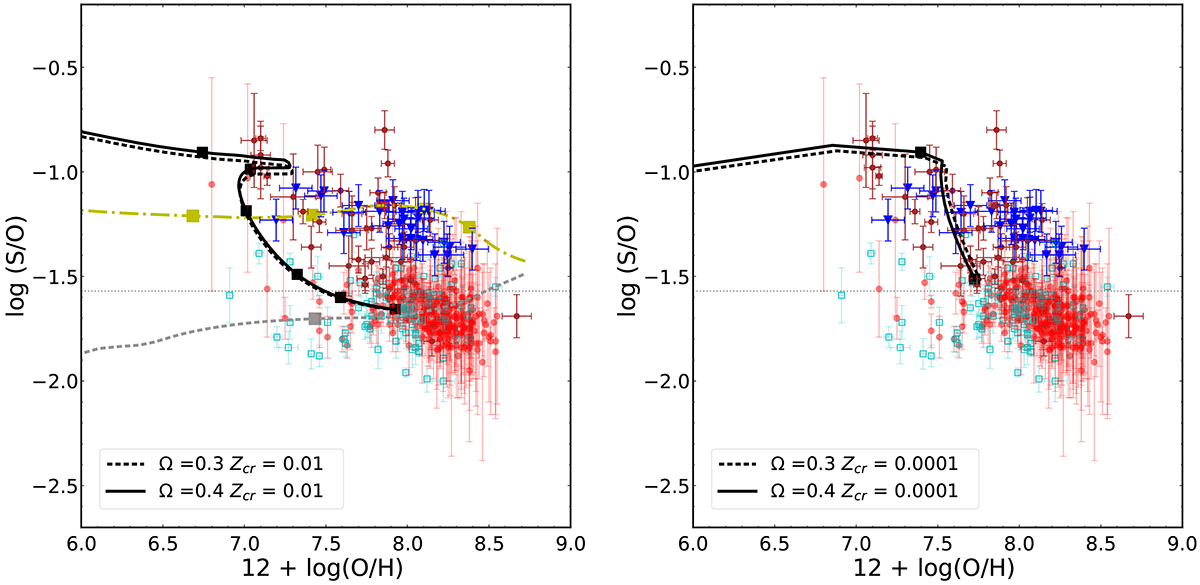
S/O ratio for two different models with PISN: M5 (M5ω3 and M5ω4) in the left panel, and M6 (M6ω3 and M6ω4) in the right panel as a function of the oxygen abundance 12 + log(O/H). The dotted and solid black lines denote the two different values of the rotational parameters. The red points are adopted from Izotov et al. (2006), and the blue triangles are adopted from Yates et al. (2020). The brown and cyan points correspond to the DHR and HII Gal subsamples of Díaz & Zamora (2022), respectively. Model M1, the dashed grey line, is a chemical evolution model representative of the MW disc (Goswami et al. 2021), where the grey square corresponds to an age of 200 Myr, and the M3 model predictions are shown as the dash-dotted yellow line. The six squares in models M5 and M3 represent the model ages at 5, 15, 30, 60, 100, and 200 Myr. For M6, only ages corresponding to 5 and 15 Myr are shown by the two squares. The values adopted for the critical metallicity Zcr and rotational parameter Ω are quoted for the two models. The dot-dashed grey line denotes the solar S/O ratio. See the text and Table 1 for details.
Current usage metrics show cumulative count of Article Views (full-text article views including HTML views, PDF and ePub downloads, according to the available data) and Abstracts Views on Vision4Press platform.
Data correspond to usage on the plateform after 2015. The current usage metrics is available 48-96 hours after online publication and is updated daily on week days.
Initial download of the metrics may take a while.