Fig. 2.
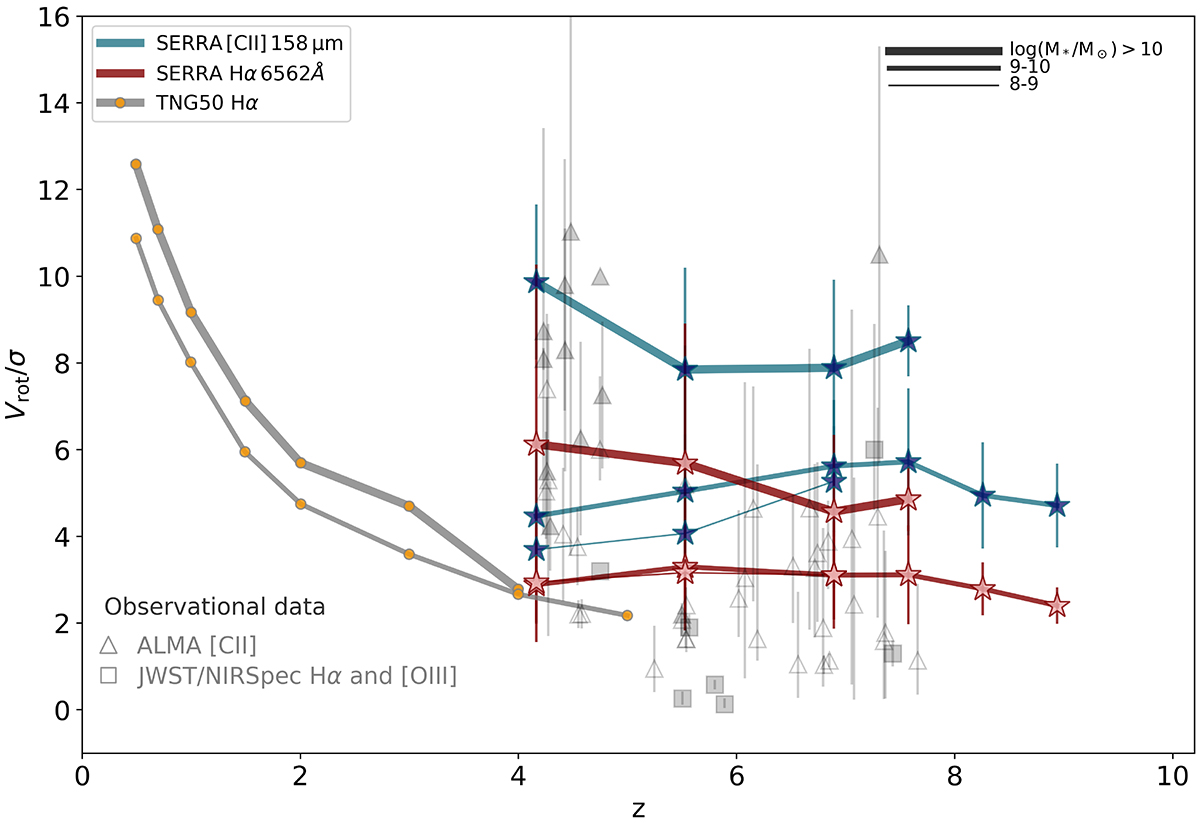
Download original image
Redshift evolution of Vrot/σ in SERRA. The three stellar mass bins are distinguished by the line width; blue (red) markers represent σ from [C II] (Hα) synthetic observations. For comparison, predictions from TNG50 simulations (Pillepich et al. 2019) are shown with filled orange markers for z < 5. The gray triangles denote observational data points with [C II] line kinematics, including high-z DCDs (Rizzo et al. 2021; Lelli et al. 2021; Fraternali et al. 2021; Tsukui & Iguchi 2021; Roman-Oliveira et al. 2023; Pope et al. 2023; Rowland et al., in prep.), ALPINE disk galaxies (Jones et al. 2021), archival 4 < z < 7.7 [C II] data (Parlanti et al. 2023), the first discovered EoR disk galaxies (Smit et al. 2018), and the turbulent HZ4 system at z = 5.5 (Herrera-Camus et al. 2022). The gray squares represent data with nebular Hα and [OIII] kinematics (de Graaff et al. 2024; Parlanti et al. 2024). The filled (empty) markers distinguish spatially (barely) resolved observations.
Current usage metrics show cumulative count of Article Views (full-text article views including HTML views, PDF and ePub downloads, according to the available data) and Abstracts Views on Vision4Press platform.
Data correspond to usage on the plateform after 2015. The current usage metrics is available 48-96 hours after online publication and is updated daily on week days.
Initial download of the metrics may take a while.