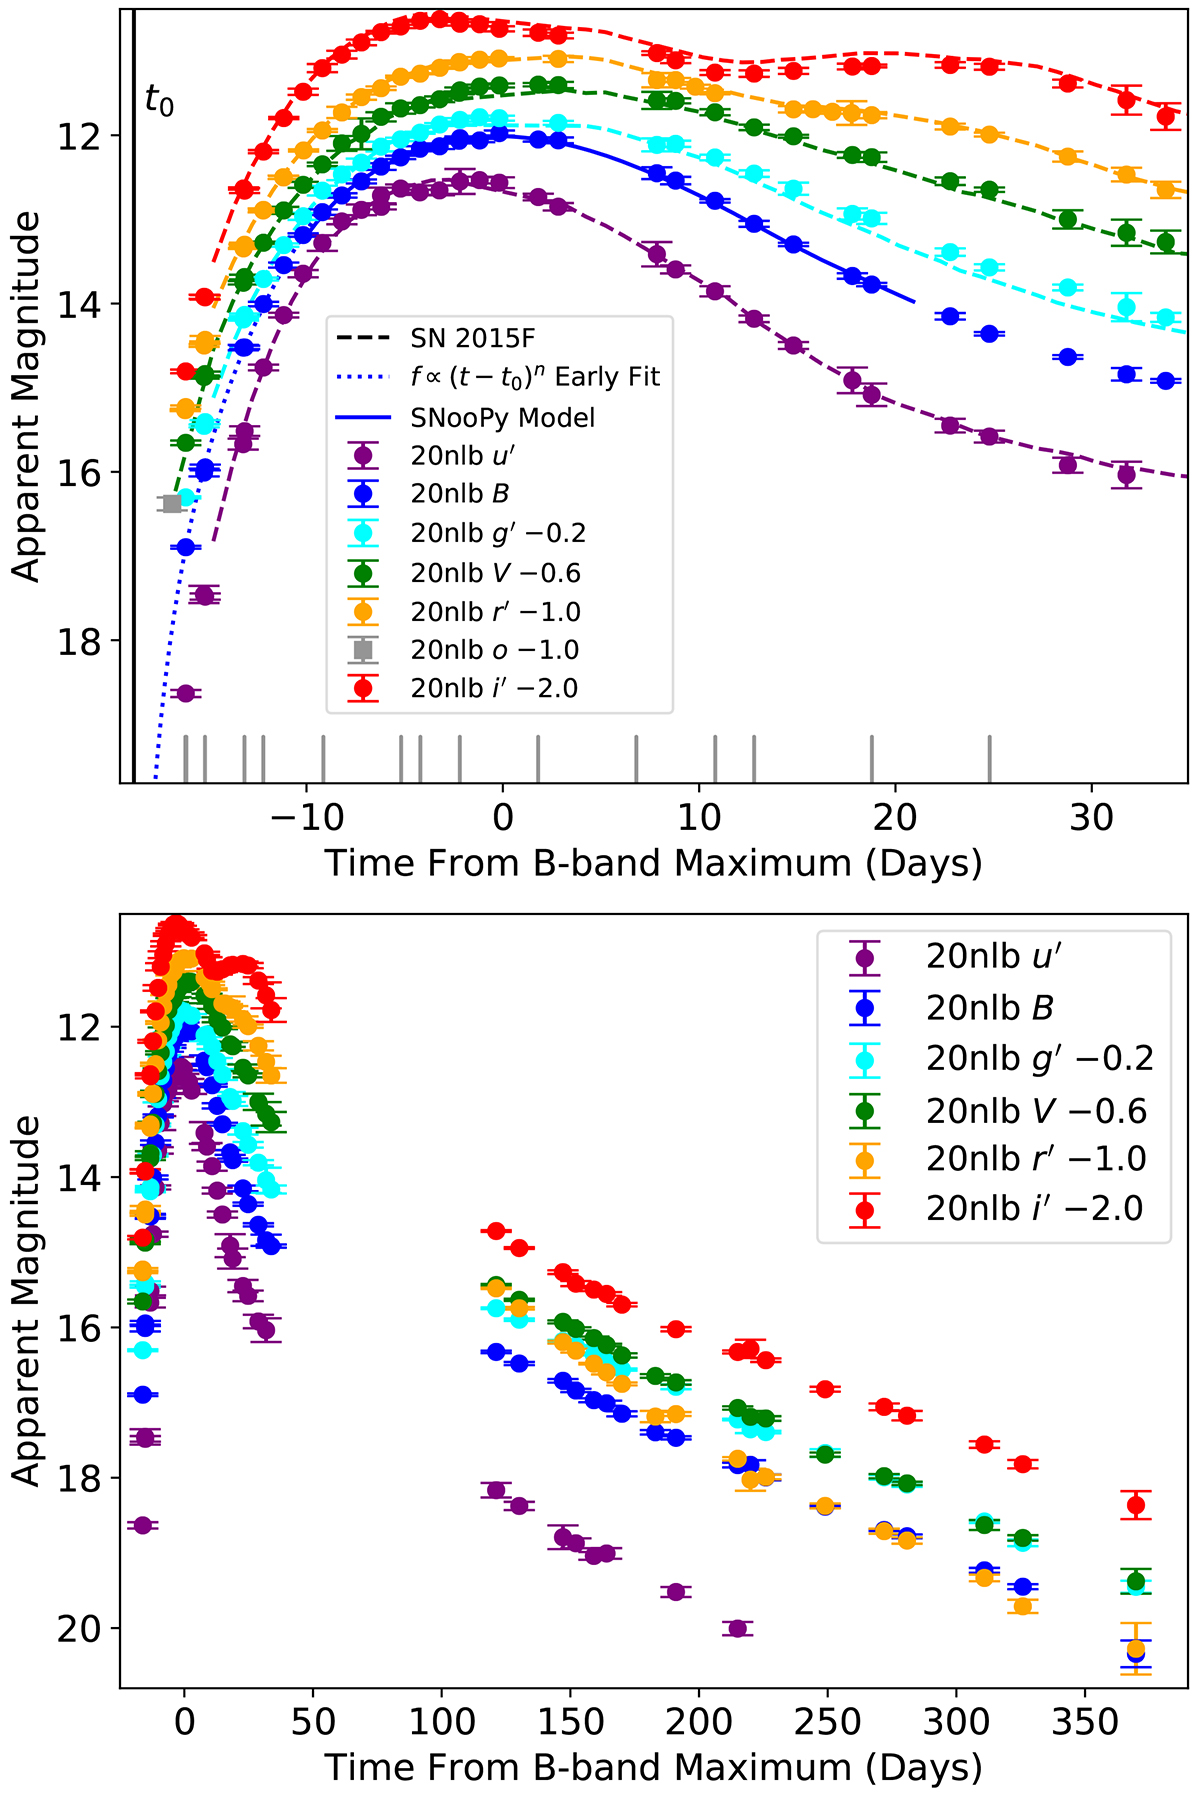
Fig. 2.
Download original image
Light curves of SN 2020nlb. Top: Our early multi-colour light curves of SN 2020nlb. The best-fit SNooPy model, and the best-fit f ∝ (t − t0)n to the early data, are shown for the B band, using a solid and dotted line respectively. The ATLAS-o discovery magnitude is also shown. The epochs that our spectra were taken are indicated by the grey lines at the bottom of the plot. The fitted first light time, t0, is also indicated. The light curve of SN 2015F (photometry from Cartier et al. 2017 and Burns et al. 2018) is shown for comparison with the dashed lines (except the B band), which has been shifted to the distance modulus we derive for M85, with the distance modulus for SN 2015F taken from Cartier et al. (2017). The light curves of both SNe have been corrected for foreground reddening only. Cartier et al. (2017) estimate E(B − V)host = 0.085 for SN 2015F. Bottom: The full light curve of SN 2020nlb stretching out to around one year after maximum light.
Current usage metrics show cumulative count of Article Views (full-text article views including HTML views, PDF and ePub downloads, according to the available data) and Abstracts Views on Vision4Press platform.
Data correspond to usage on the plateform after 2015. The current usage metrics is available 48-96 hours after online publication and is updated daily on week days.
Initial download of the metrics may take a while.