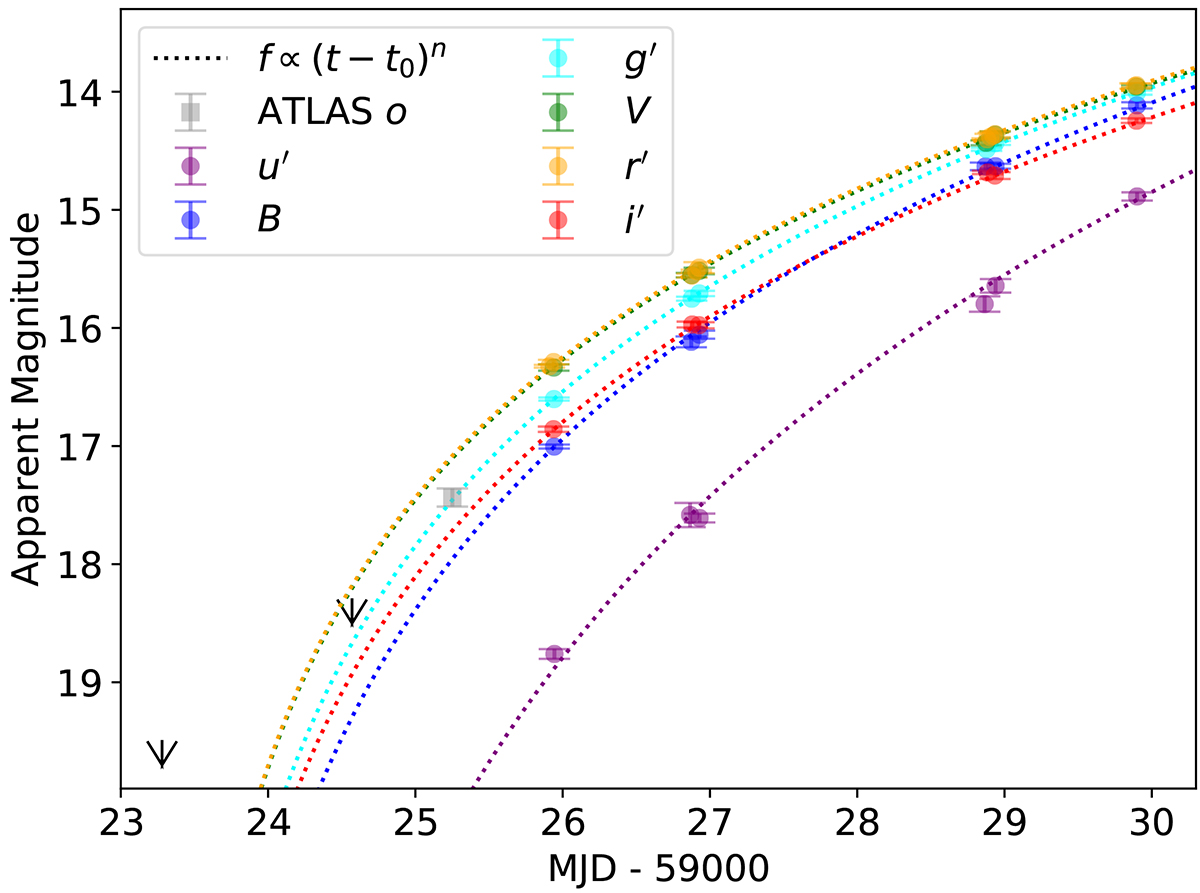
Fig. A.1.
Download original image
Early light curve of SN 2020nlb shown in apparent magnitude scale. The coloured dashed lines represent the power-law fits to the earlier data described in the main text. The earlier upper limit is in the ATLAS-cyan filter, and the second later upper limit is from the Itagaki Astronomical Observatory’s 0.35 m telescope reported in Sand et al. (2021). No offset has been applied to any of the photometric data here, so it is easier to visually interpret the upper limits, which are in different filters to the detections.
Current usage metrics show cumulative count of Article Views (full-text article views including HTML views, PDF and ePub downloads, according to the available data) and Abstracts Views on Vision4Press platform.
Data correspond to usage on the plateform after 2015. The current usage metrics is available 48-96 hours after online publication and is updated daily on week days.
Initial download of the metrics may take a while.