Fig. 14.
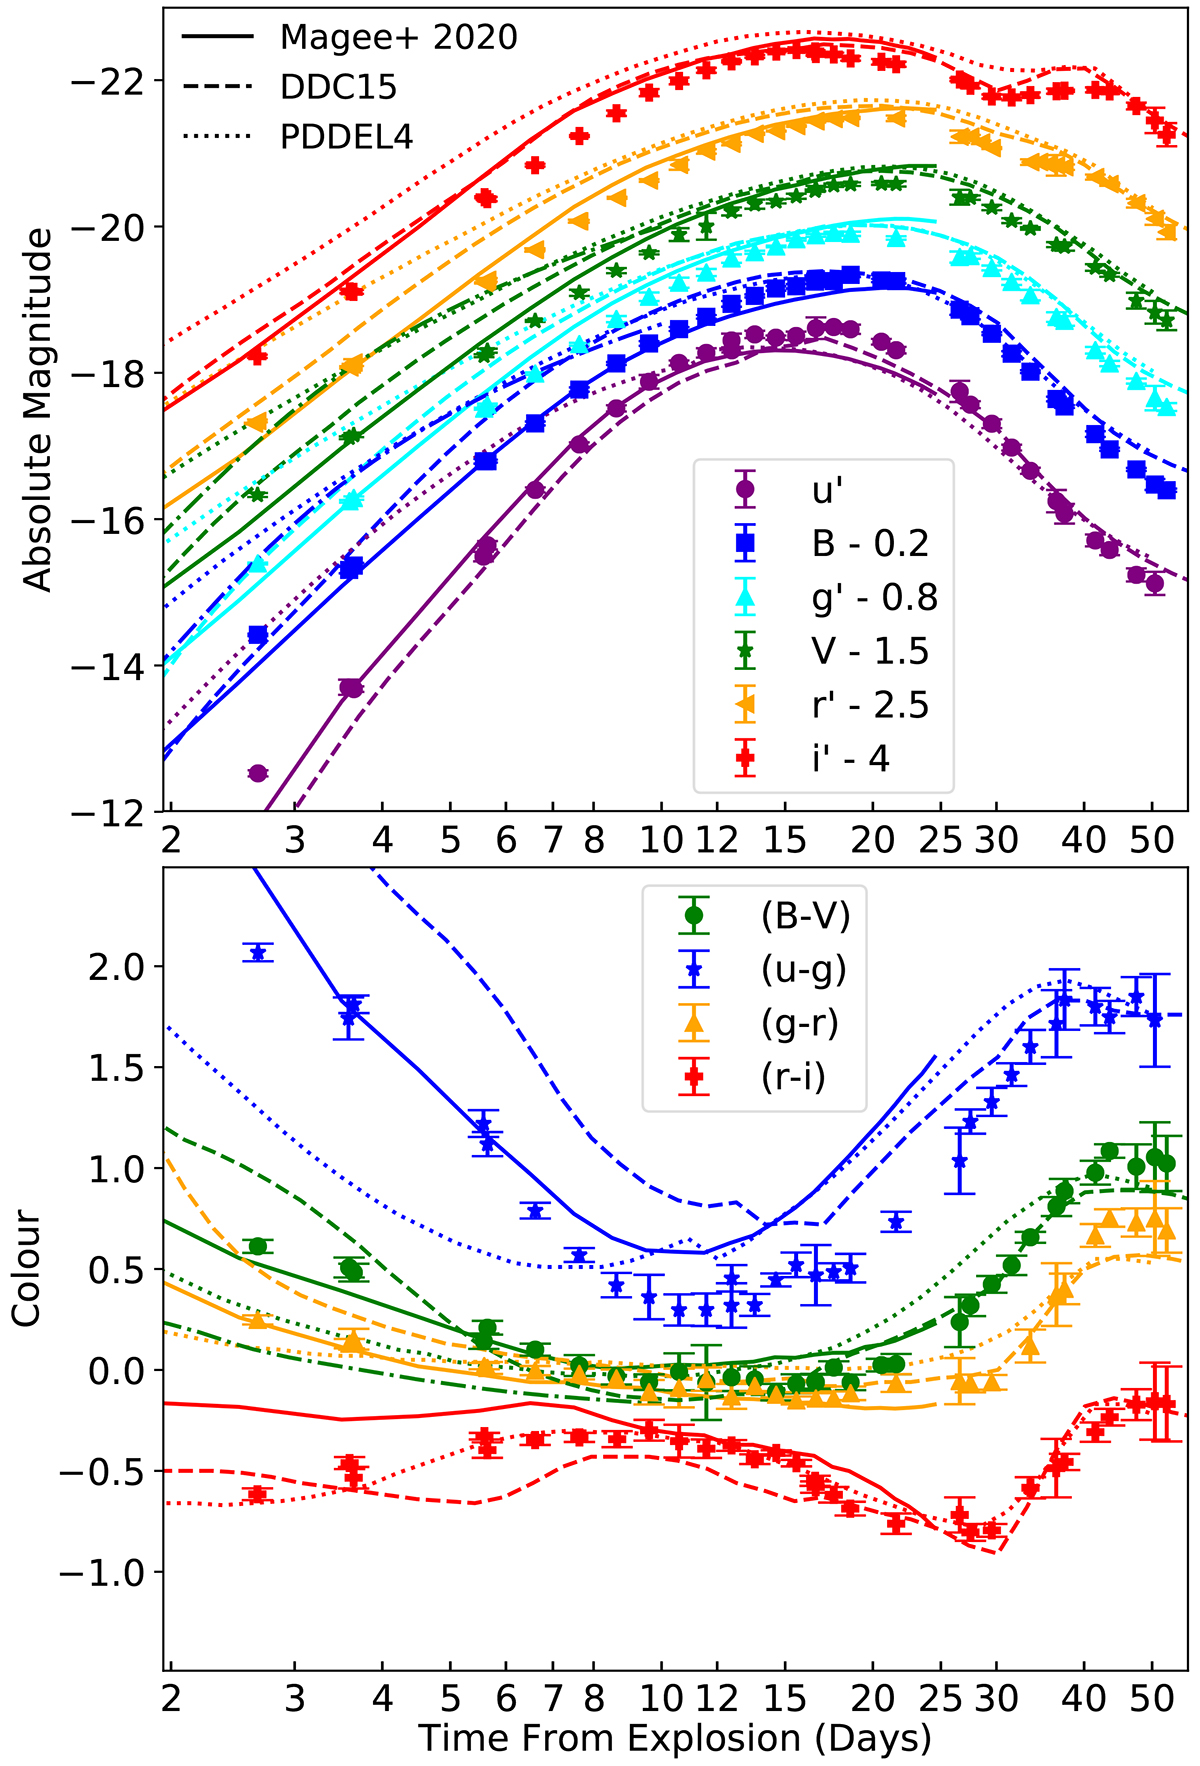
Download original image
Light curve and colours of SN 2020nlb (corrected for extinction) compared to models. The dashed and dotted lines represent the delayed detonation DDC15 and pulsating delayed detonation PDDEL4 models from Dessart et al. (2014) respectively. The solid lines show the EXP_Ni0.6_KE1.10_P9.7 model from Magee et al. (2020). The dot-dash lines show early BV photometry for a MWD = 1.06 M⊙ detonation (Noebauer et al. 2017). The time axis is shown in log space to make early-time variations clearer.
Current usage metrics show cumulative count of Article Views (full-text article views including HTML views, PDF and ePub downloads, according to the available data) and Abstracts Views on Vision4Press platform.
Data correspond to usage on the plateform after 2015. The current usage metrics is available 48-96 hours after online publication and is updated daily on week days.
Initial download of the metrics may take a while.