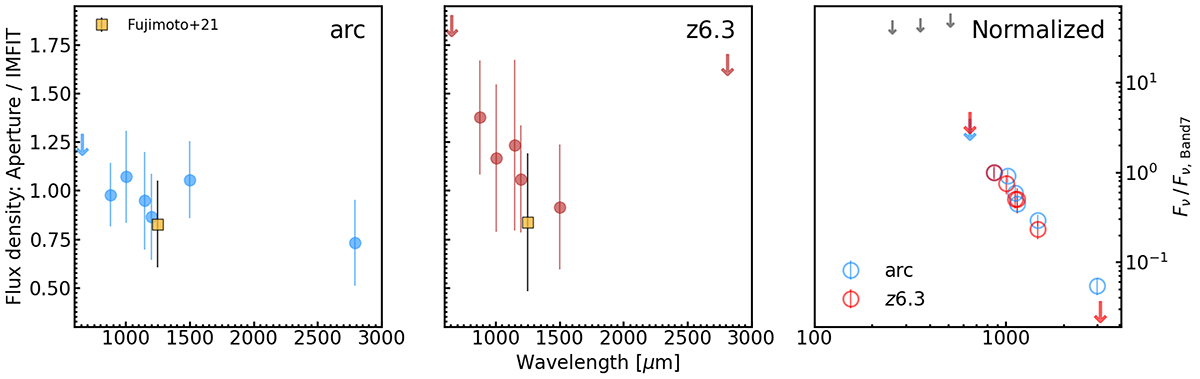
Fig. A.2.
Download original image
Photometric extractions. Filled circles indicate the ratio between the observed photometry extracted in Kron apertures and that from modeling with CASA/IMFIT. Large arrows show the 2σ upper limits on aperture photometry. Small gray arrows are 3σ upper limits on Herschel/SPIRE from Sun et al. (2022). For reference, we show both the measured Band 6 flux densities in configuration C2 and the combined C2+C5 (offset to improve the readability). Left: Arc (z6.1-6.2). Center: z6.3. Right: Aperture photometry of both lensed images. The flux densities are normalized to that in Band 7 (122 μm rest frame) for clarity and to avoid introducing the uncertainties on the magnification factor. The measurements in Band 6 (158 μm rest frame) from Fujimoto et al. (2021) are shown as orange squares.
Current usage metrics show cumulative count of Article Views (full-text article views including HTML views, PDF and ePub downloads, according to the available data) and Abstracts Views on Vision4Press platform.
Data correspond to usage on the plateform after 2015. The current usage metrics is available 48-96 hours after online publication and is updated daily on week days.
Initial download of the metrics may take a while.