Fig. A.1.
Download original image
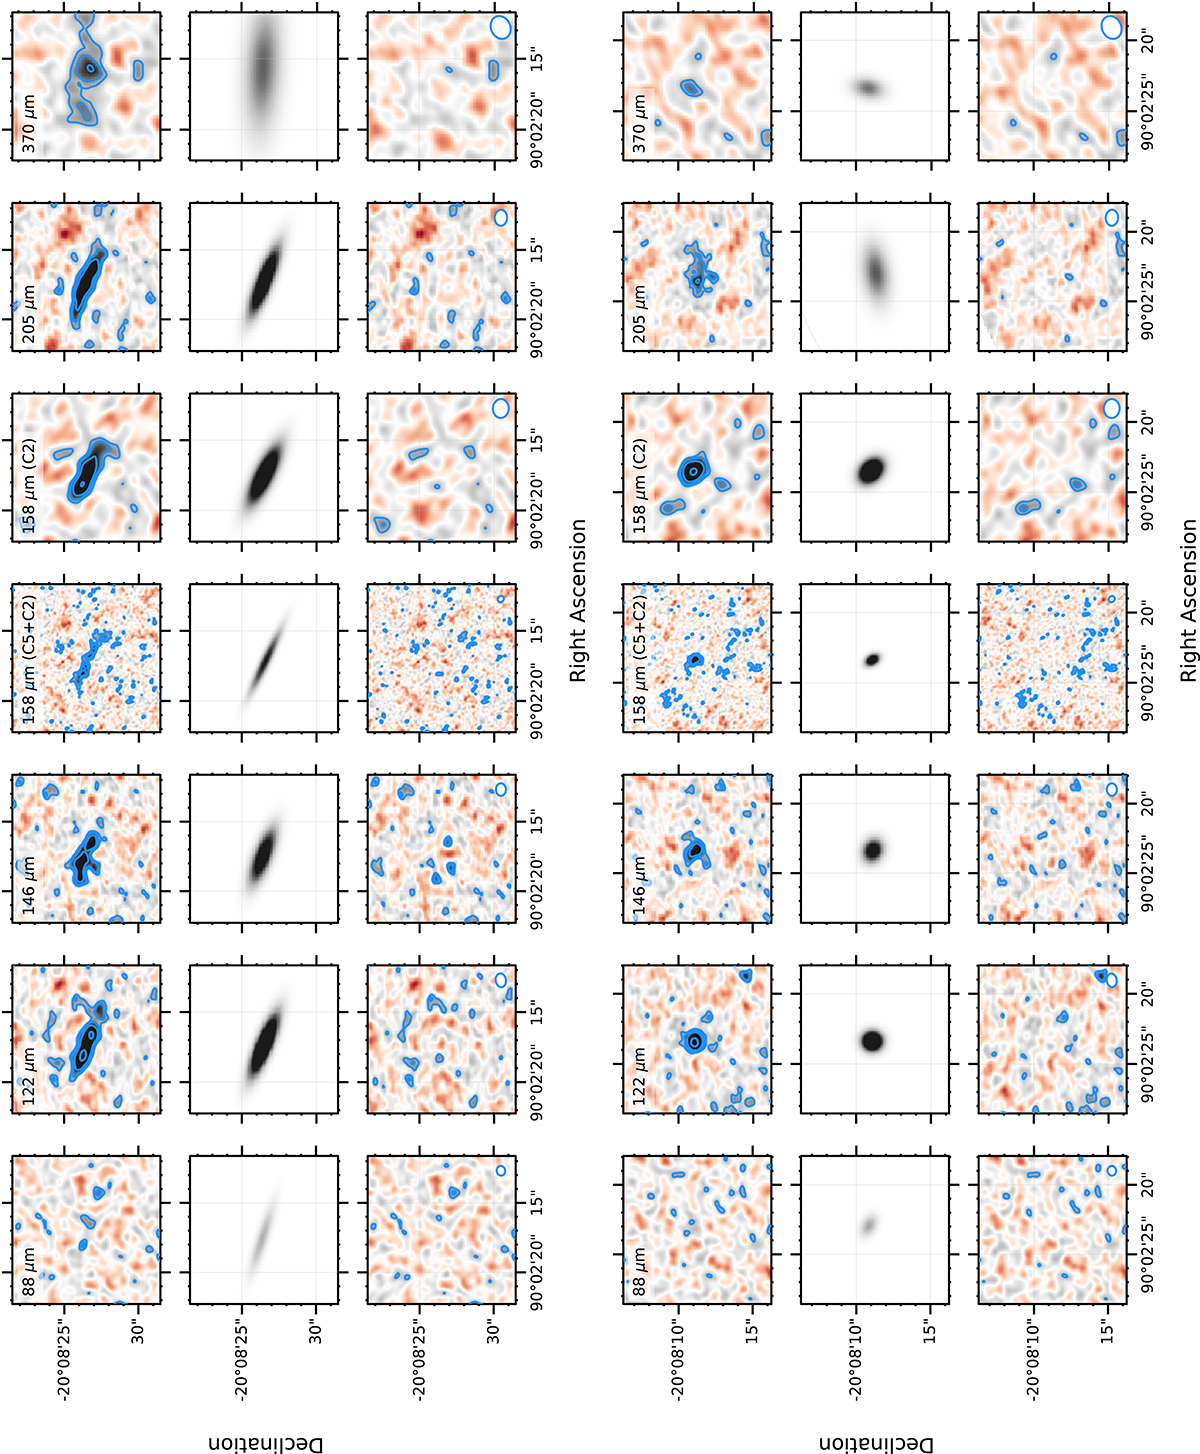
Dust continuum maps, best-fit Gaussian modeling, and residuals for the lensed z6.1-6.2 (arc, top rows) and z6.3 (bottom rows) images. The side of each cutout is 10". The rest-frame wavelengths of each map are labeled. Blue contours are at 2, 3, 5, and 10σ (rms). The images are color-scaled within ±5 times the rms per pixel in each band. The beam is shown in the bottom-right corner of the cutouts of the residuals.
Current usage metrics show cumulative count of Article Views (full-text article views including HTML views, PDF and ePub downloads, according to the available data) and Abstracts Views on Vision4Press platform.
Data correspond to usage on the plateform after 2015. The current usage metrics is available 48-96 hours after online publication and is updated daily on week days.
Initial download of the metrics may take a while.