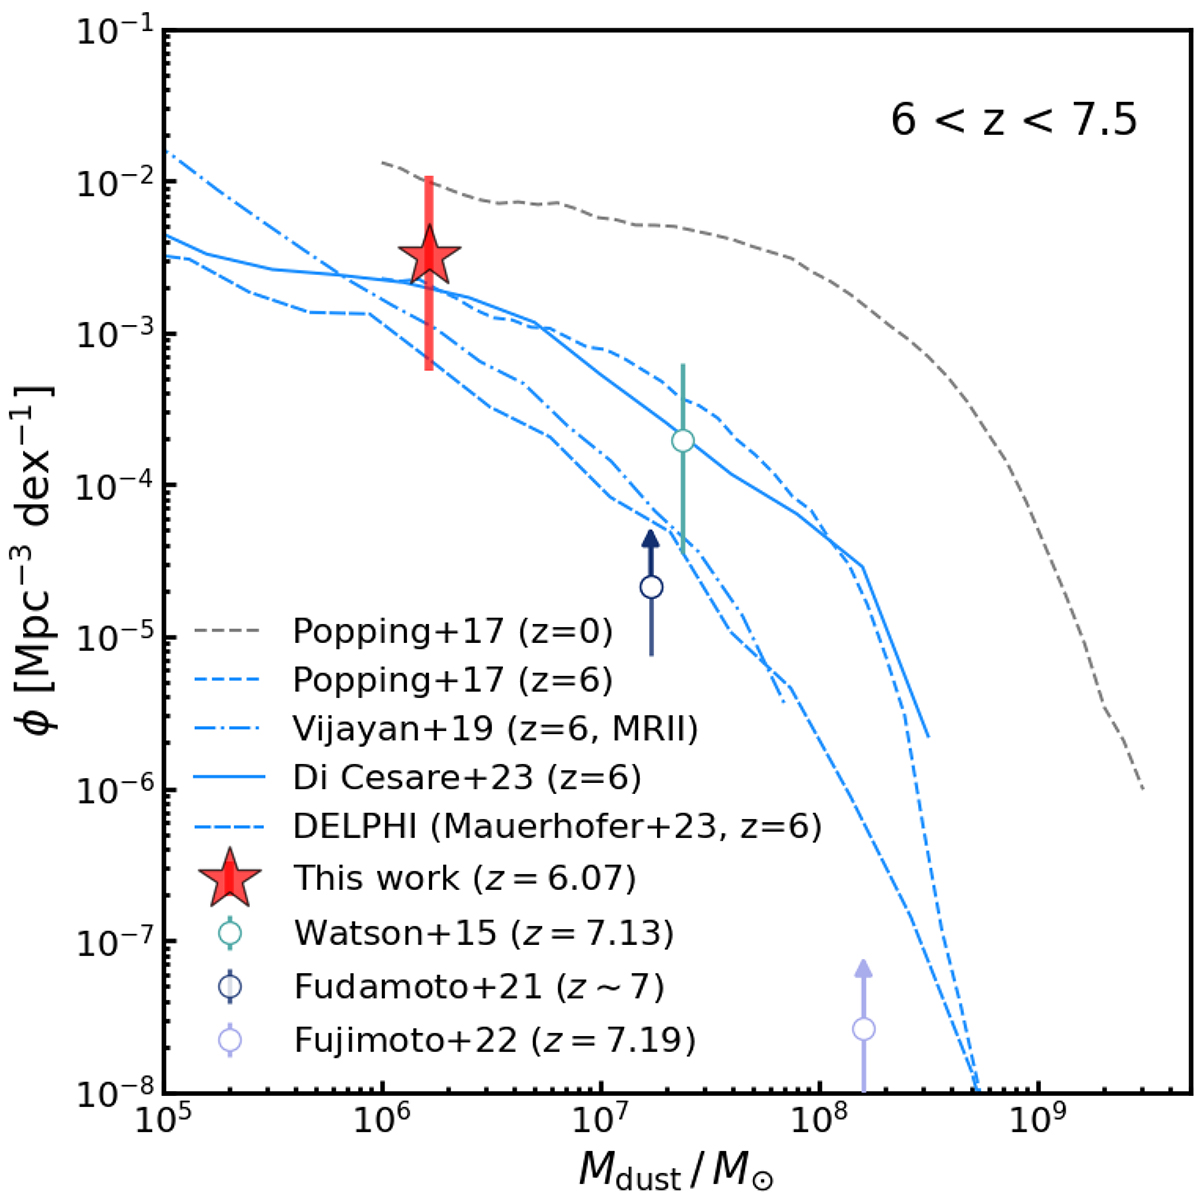
Fig. 7.
Download original image
Dust mass function. The blue lines show the predictions of the models at z = 6, as labeled (Popping et al. 2017; Vijayan et al. 2019; Di Cesare et al. 2023; DELPHI, Dayal et al. 2022; Mauerhofer & Dayal 2023). For reference, the dashed gray line marks the dust mass function from the fiducial model in Popping et al. (2017) at z = 0. The filled red star and open circles indicate the observational constraints based on our target and other surveys at high redshifts, as labeled (Watson et al. 2015; Bakx et al. 2021; Akins et al. 2022; Fudamoto et al. 2021; Fujimoto et al. 2022; ϕ values estimated in Fujimoto et al. 2023).
Current usage metrics show cumulative count of Article Views (full-text article views including HTML views, PDF and ePub downloads, according to the available data) and Abstracts Views on Vision4Press platform.
Data correspond to usage on the plateform after 2015. The current usage metrics is available 48-96 hours after online publication and is updated daily on week days.
Initial download of the metrics may take a while.