Fig. 6.
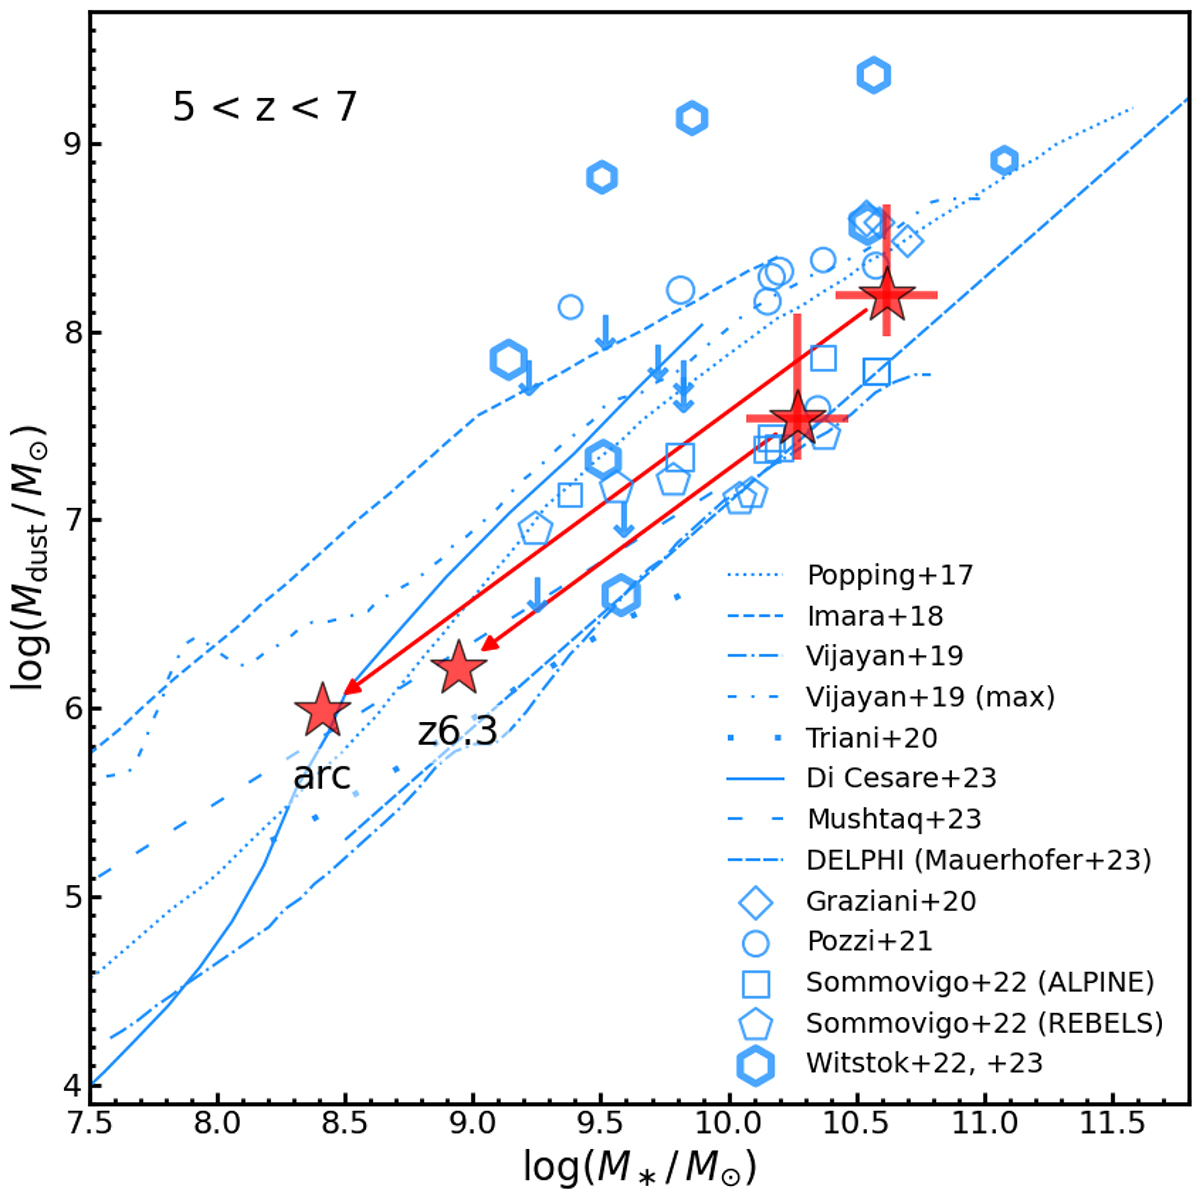
Download original image
Dust mass as a function of stellar mass at 5 < z < 7. The red stars indicate the arc and z6.3 images of our galaxy, as labeled. Red arrows show the direction of the correction for the lensing magnification. The open blue symbols mark observed galaxies from the works in the legend. The empirical estimates are from Graziani et al. (2020), Pozzi et al. (2021), Sommovigo et al. (2021, 2022), and Witstok et al. (2022, 2023); the models are from Popping et al. (2017), Imara et al. (2018), Vijayan et al. (2019), Triani et al. (2020), Di Cesare et al. (2023), Mushtaq et al. (2023), Dayal et al. (2022), and Mauerhofer & Dayal (2023). Arrows indicate upper limits. Blue lines show the predictions for the models listed in the legend.
Current usage metrics show cumulative count of Article Views (full-text article views including HTML views, PDF and ePub downloads, according to the available data) and Abstracts Views on Vision4Press platform.
Data correspond to usage on the plateform after 2015. The current usage metrics is available 48-96 hours after online publication and is updated daily on week days.
Initial download of the metrics may take a while.