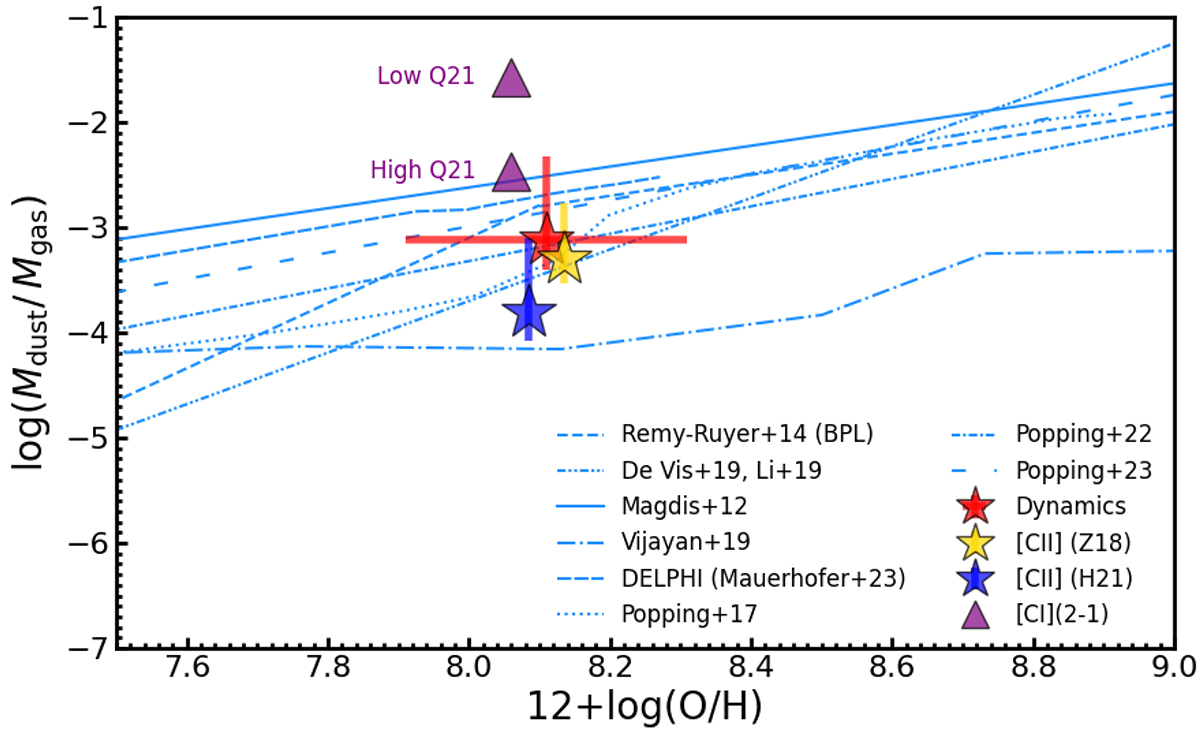
Fig. 5.
Download original image
Dust-to-gas mass ratio as a function of metallicity. Purple triangles indicate the 3σ lower limits from [C I](3P2−3P1) under high- and low-excitation conditions. The gold and blue stars indicate Mgas from [C II] using the conversions in Zanella et al. (2018) and Heintz et al. (2021), respectively. The red star shows the maximum amount of gas allowed by [C II] dynamics (F21). The points are slightly offset along the X axis for clarity. The uncertainty on the metallicity is represented by the horizontal red bar. The blue lines mark the (extrapolated) relations from Magdis et al. (2012), Rémy-Ruyer et al. (2014), De Vis et al. (2019), Popping & Péroux (2022), and Popping et al. (2023), and the models from Mauerhofer & Dayal (2023), Popping et al. (2017), Li et al. (2019), and Vijayan et al. (2019).
Current usage metrics show cumulative count of Article Views (full-text article views including HTML views, PDF and ePub downloads, according to the available data) and Abstracts Views on Vision4Press platform.
Data correspond to usage on the plateform after 2015. The current usage metrics is available 48-96 hours after online publication and is updated daily on week days.
Initial download of the metrics may take a while.