Fig. 4.
Download original image
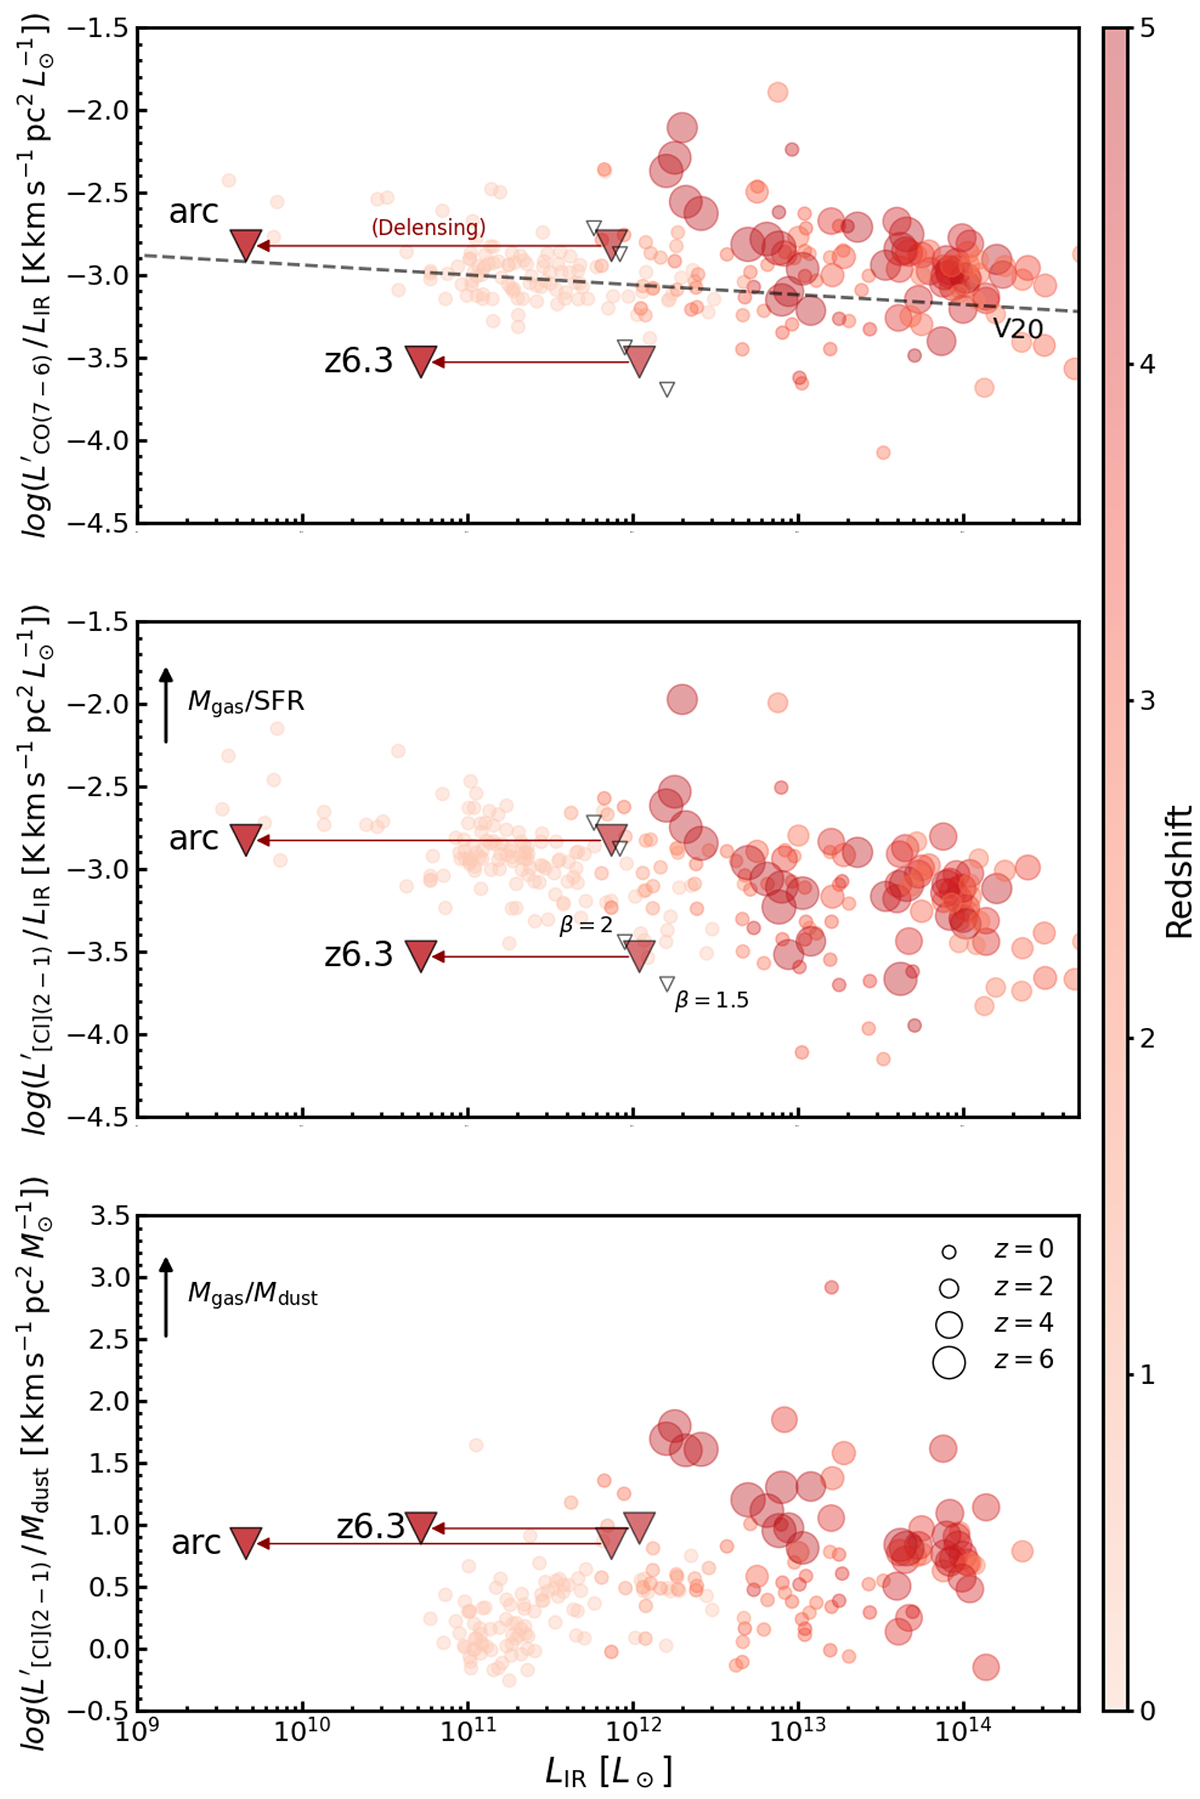
Observed L′/LIR for CO (7 − 6) (top), [C I](3P2−3P1) (center), and ![]() /Mdust ratios (bottom) as a function of LIR for our targets, as labeled (downward triangles; 3σ upper limits) and a literature compilation described in Appendix B (red circles; colors and sizes scale with redshift). The red arrows connect the observed and de-lensed estimates of LIR for our targets. The open triangles show the upper limits on our targets when fixing β = 1.5 − 2 in the SED modeling. The dashed line in the top panel indicates the empirical
/Mdust ratios (bottom) as a function of LIR for our targets, as labeled (downward triangles; 3σ upper limits) and a literature compilation described in Appendix B (red circles; colors and sizes scale with redshift). The red arrows connect the observed and de-lensed estimates of LIR for our targets. The open triangles show the upper limits on our targets when fixing β = 1.5 − 2 in the SED modeling. The dashed line in the top panel indicates the empirical ![]() relation from Valentino et al. (2020a). The black arrows in the central and bottom panels indicate the direction of increasing depletion timescales (
relation from Valentino et al. (2020a). The black arrows in the central and bottom panels indicate the direction of increasing depletion timescales (![]() /LIR ∝ Mgas/SFR) and the dust-to-gas mass ratio (
/LIR ∝ Mgas/SFR) and the dust-to-gas mass ratio (![]() /
/![]() ), respectively.
), respectively.
Current usage metrics show cumulative count of Article Views (full-text article views including HTML views, PDF and ePub downloads, according to the available data) and Abstracts Views on Vision4Press platform.
Data correspond to usage on the plateform after 2015. The current usage metrics is available 48-96 hours after online publication and is updated daily on week days.
Initial download of the metrics may take a while.