Fig. 1.
Download original image
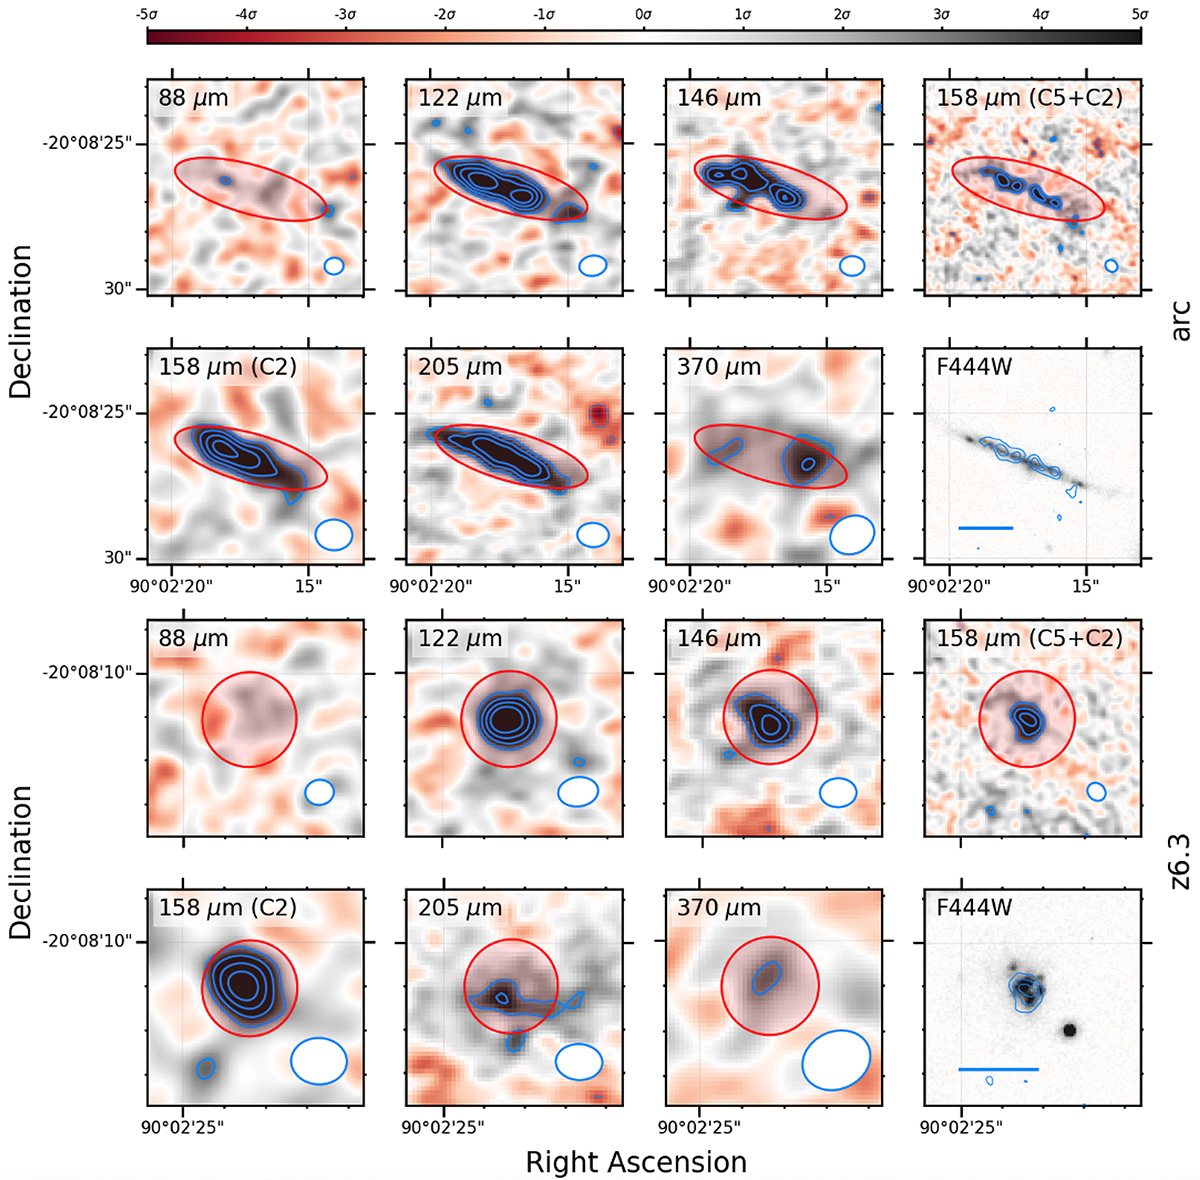
ALMA continuum bands of the arc (top rows, 7.5″ side) and the z6.3 image (bottom rows, 5″ side). The rest-frame wavelength of each map is labeled. The ALMA images are color-scaled within ±5 times the rms per pixel in each band. Solid (positive) and dashed (negative) blue contours are at ±3, 5, 7, and 9σ. The solid red line and shaded area indicate the aperture adopted to extract the photometry. The beam size is shown in the bottom-right corner of each cutout. The bottom-right panel of each series shows the JWST/NIRCam image at 4.5 μm. In the latter, the point spread function has a full width at half maximum of ![]() and the blue contours mark the continuum at 158 μm (C5+C2). The blue bar shows a 10 kpc scale.
and the blue contours mark the continuum at 158 μm (C5+C2). The blue bar shows a 10 kpc scale.
Current usage metrics show cumulative count of Article Views (full-text article views including HTML views, PDF and ePub downloads, according to the available data) and Abstracts Views on Vision4Press platform.
Data correspond to usage on the plateform after 2015. The current usage metrics is available 48-96 hours after online publication and is updated daily on week days.
Initial download of the metrics may take a while.