Fig. 6
Download original image
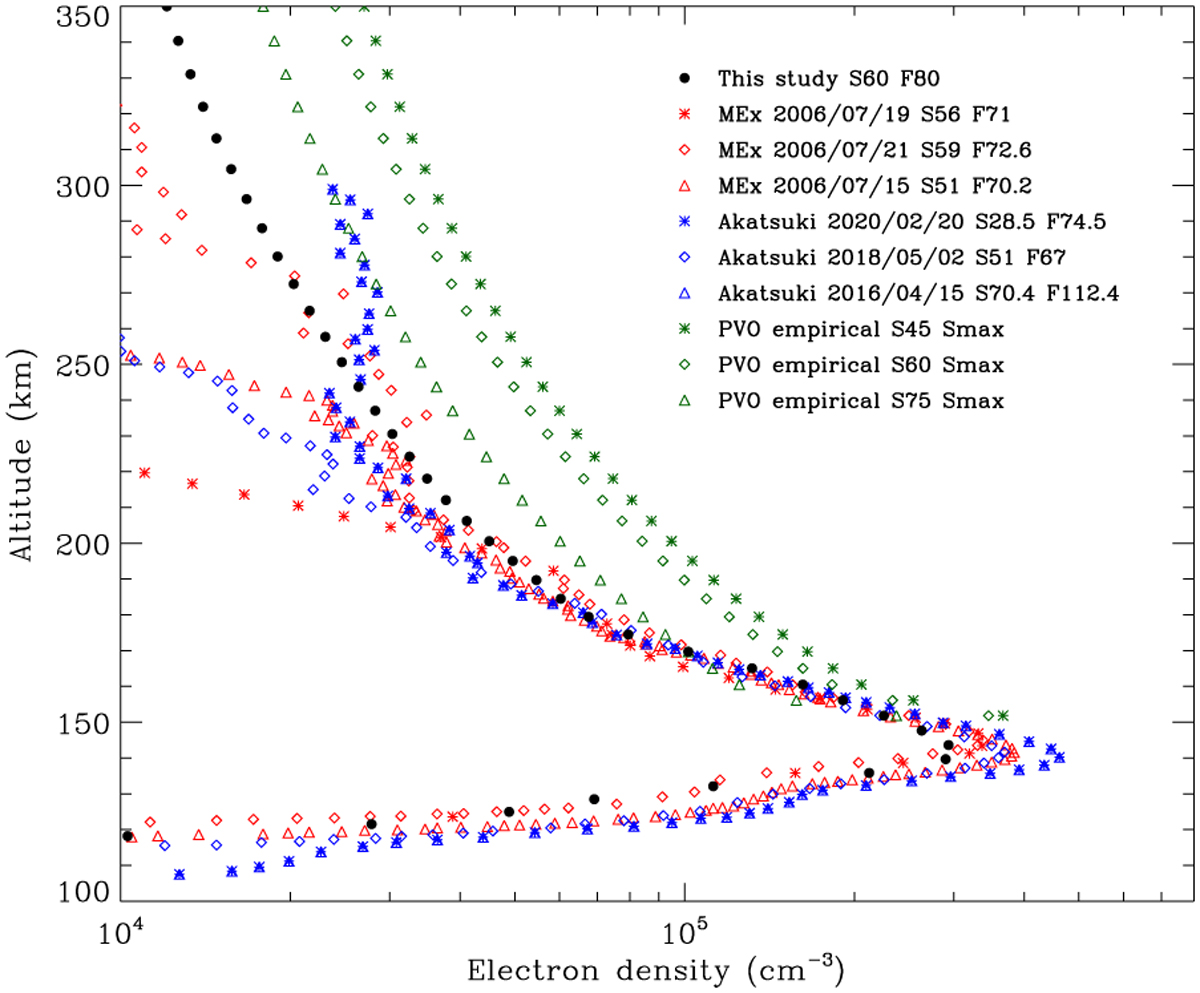
Comparison of the electron density distribution between this study (appropriate for a SZA of 60° and a 10.7 cm solar radio index of 80 SFU) and various measurements. The solid circles are for the model density profile, the red symbols are for the VEx RO measurements covering a narrow SZA interval of 50°–60° and all at solar minimum, the blue symbols are for the Akatsuki RO measurements covering wider ranges of both SZA and 10.7 cm solar radio index, whereas the green symbols are extracted from the empirical model of Theis et al. (1984) based on the PVO in-situ measurements at solar maximum. Numbers starting with “S” and “F” refer to the corresponding values of the SZA (in degree) and 10.7 cm solar radio index (in SFU). “Smax” stands for “solar maximum.” The dates when the MEx and Akatsuki RO experiments were made are indicated in the figure legend for reference.
Current usage metrics show cumulative count of Article Views (full-text article views including HTML views, PDF and ePub downloads, according to the available data) and Abstracts Views on Vision4Press platform.
Data correspond to usage on the plateform after 2015. The current usage metrics is available 48-96 hours after online publication and is updated daily on week days.
Initial download of the metrics may take a while.