Fig. 5
Download original image
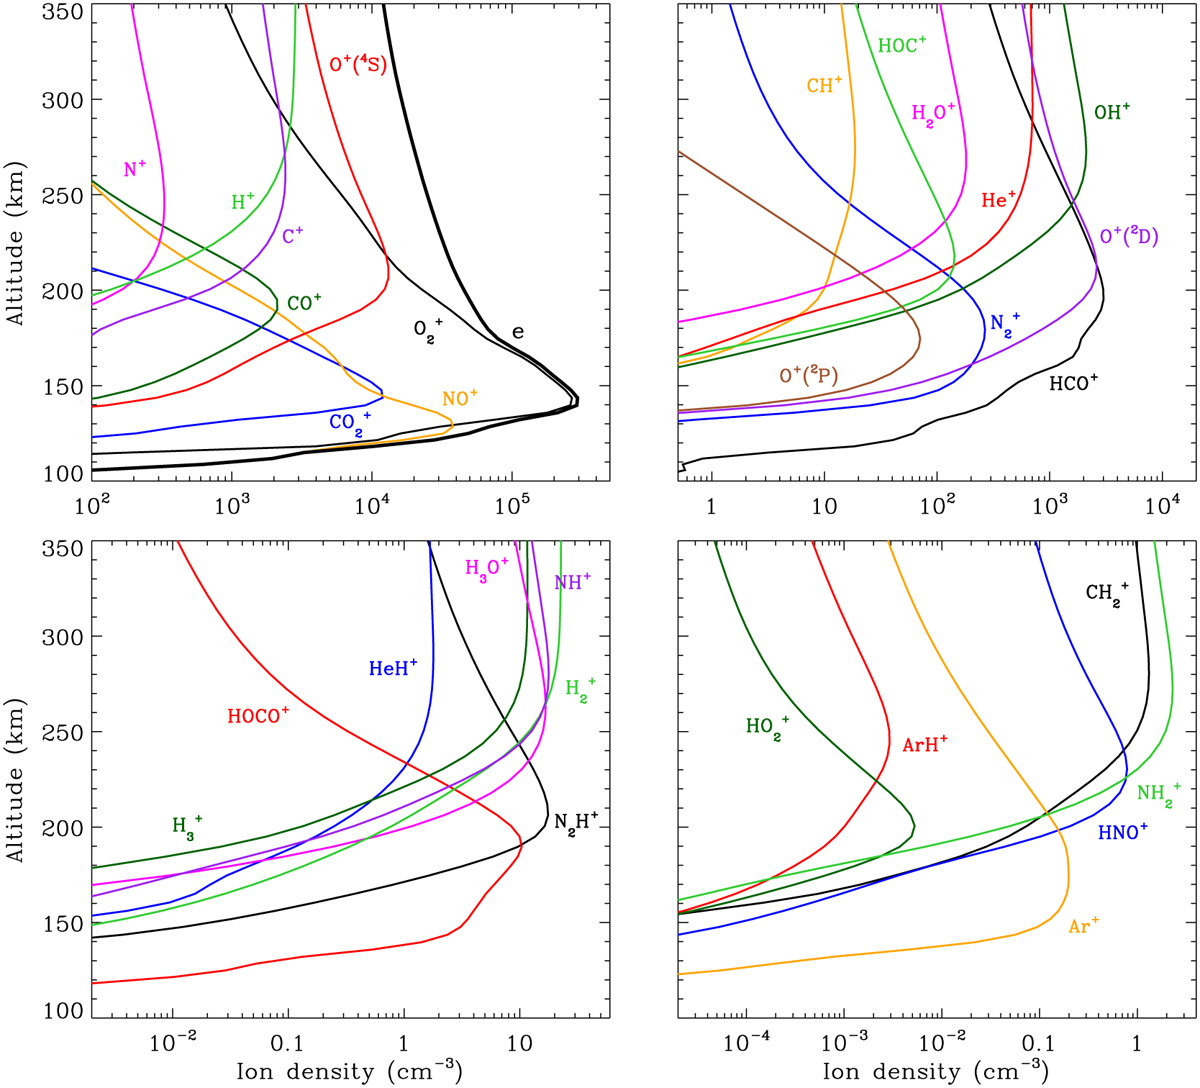
Dayside averaged density profiles of various ion species in the Venusian ionosphere based on our solar minimum model calculations. All species display well-defined peak structures, usually superimposed by secondary peaks at lower altitudes though typically manifest as shoulders. The thick solid line in the upper left panel represents the electron distribution inferred from charge neutrality.
Current usage metrics show cumulative count of Article Views (full-text article views including HTML views, PDF and ePub downloads, according to the available data) and Abstracts Views on Vision4Press platform.
Data correspond to usage on the plateform after 2015. The current usage metrics is available 48-96 hours after online publication and is updated daily on week days.
Initial download of the metrics may take a while.