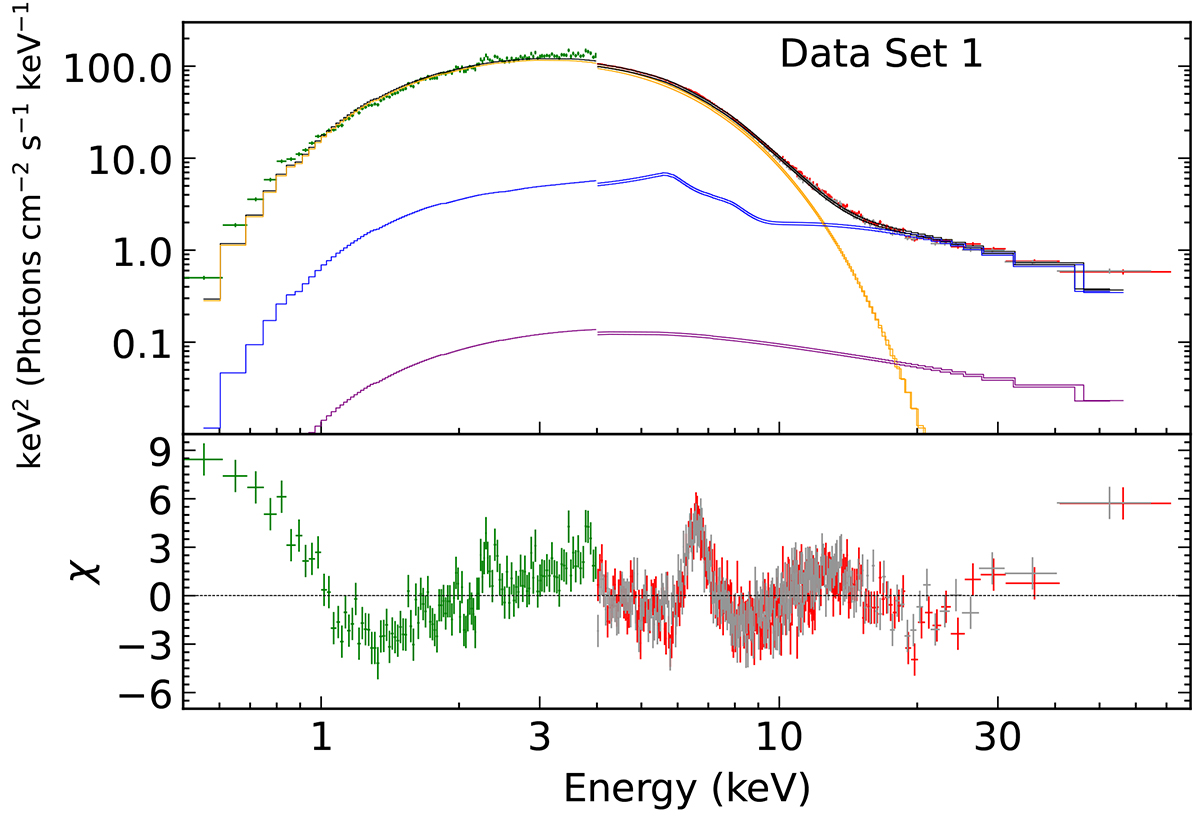
Fig. 4.
Download original image
Spectra, model components, and spectral residuals for tbabs*(diskbb+nthcomp+relxillcp*nthratio). Data set 1 of Swift and NuSTAR are taken as representative. The green, red, and gray data points show the Swift, NuSTAR/FPMA, and FPMB data, respectively. The black solid line is the total model, and the orange, purple, and blue solid lines show the diskbb, nthcomp, and relxillcp*nthratio components.
Current usage metrics show cumulative count of Article Views (full-text article views including HTML views, PDF and ePub downloads, according to the available data) and Abstracts Views on Vision4Press platform.
Data correspond to usage on the plateform after 2015. The current usage metrics is available 48-96 hours after online publication and is updated daily on week days.
Initial download of the metrics may take a while.