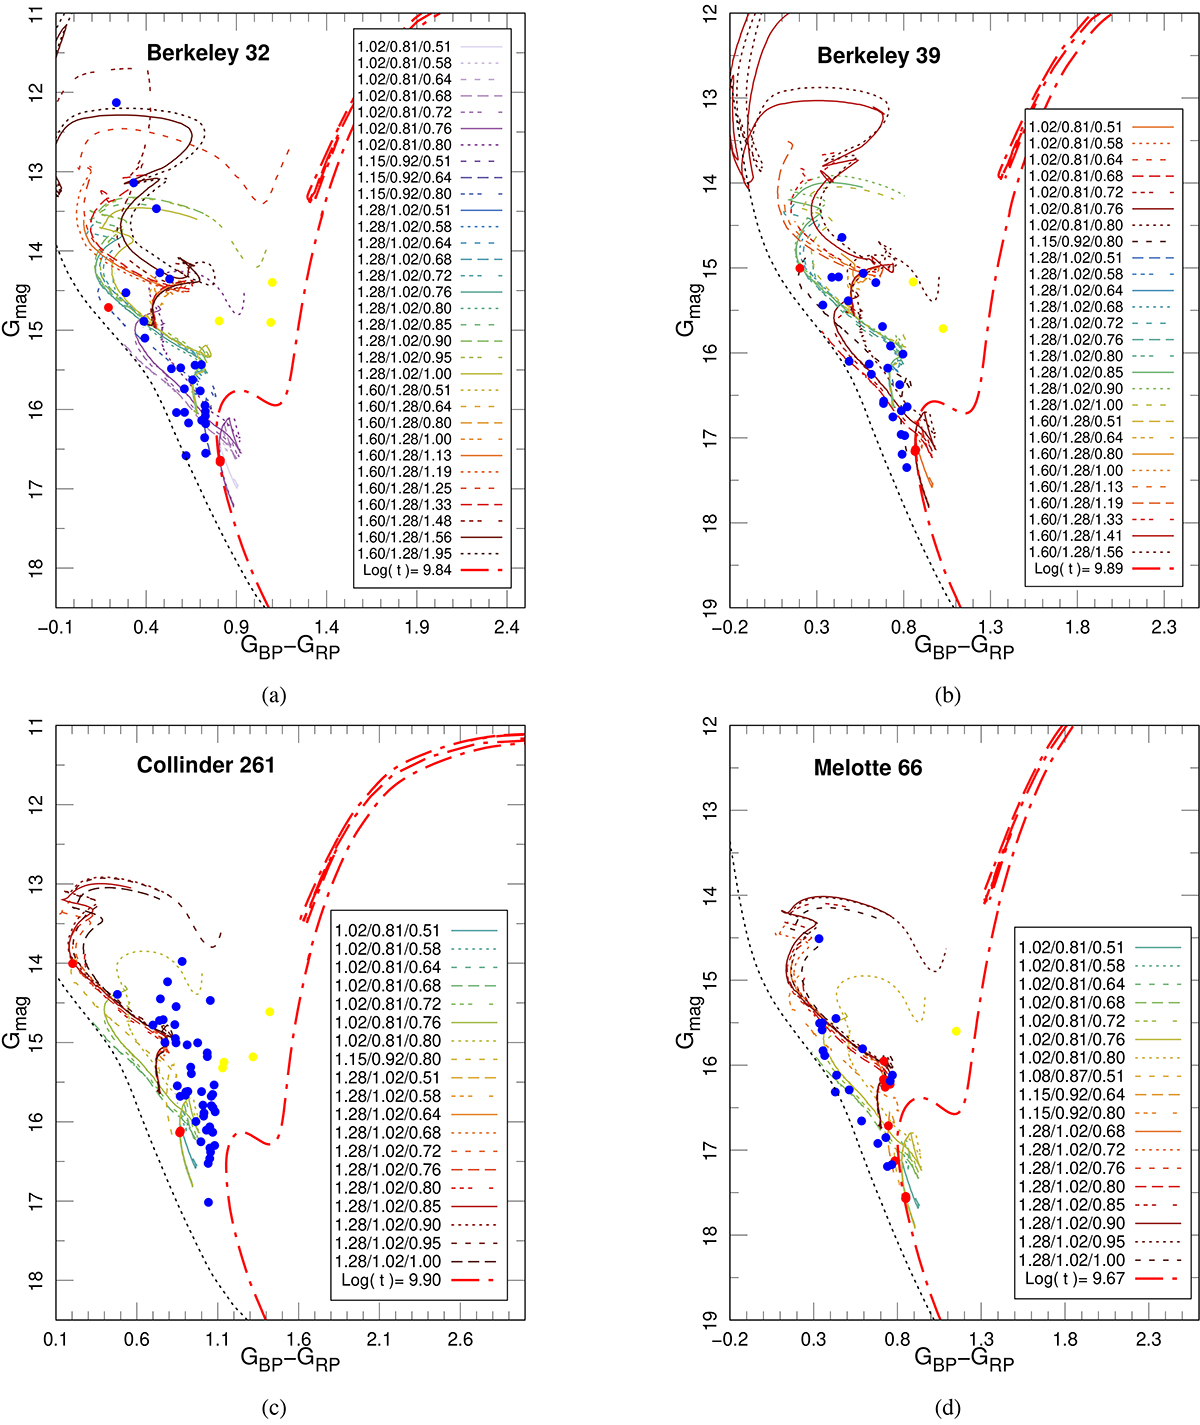
Fig. B.1.
Download original image
Color-magnitude diagrams. The combined binary tracks are represented as solid, dotted, short-dashed, long-dashed, and three short-dashed colored lines. The dotted black lines depict the ZAMS, and dot-dashed red lines represent the corresponding isochrones (in Log(t[yr])) for single models. The BSSs are indicated by filled blue circles, and YSSs are shown by filled yellow circles. The filled red circles indicate the cluster age. The sets of three numbers denote the M1/M2/P donor mass (in M⊙), the accretor mass (in M⊙), and the period (in days).
Current usage metrics show cumulative count of Article Views (full-text article views including HTML views, PDF and ePub downloads, according to the available data) and Abstracts Views on Vision4Press platform.
Data correspond to usage on the plateform after 2015. The current usage metrics is available 48-96 hours after online publication and is updated daily on week days.
Initial download of the metrics may take a while.