| Issue |
A&A
Volume 684, April 2024
|
|
|---|---|---|
| Article Number | A211 | |
| Number of page(s) | 10 | |
| Section | Extragalactic astronomy | |
| DOI | https://doi.org/10.1051/0004-6361/202349038 | |
| Published online | 24 April 2024 | |
Up around the bend: A multiwavelength view of the quasar 3C 345⋆
1
Max-Planck-Institut für Radioastronomie, Auf dem Hügel 69, 53121 Bonn, Germany
e-mail: This email address is being protected from spambots. You need JavaScript enabled to view it.
2
National Radio Astronomy Observatory, PO Box O, Socorro, NM, 87801
USA
Received:
20
December
2023
Accepted:
19
February
2024
Abstract
Context. The flat-spectrum radio quasar 3C 345 has been showing γ-ray activity since the mid-2000s, along with activity across the electromagnetic spectrum. A γ-ray burst in 2009 was successfully linked to relativistic outflow in 43 GHz very long baseline interferometry (VLBI) observations and has since also been analyzed using single-dish measurements. A multiwavelength follow-up VLBI observation of the 2009 flare in conjunction with 43 GHz catalog data from the VLBA-BU-BLAZAR and BEAM-ME programs are analyzed in this study in the context of the long-term evolution of the source.
Aims. We aim to probe the innermost few milliarcseconds of the ultracompact 3C 345 jet. To do so, we analyzed the long-term kinematics of the inner jet and discuss the magnetic field morphology at different scales, as well as the origin of the γ-ray emission.
Methods. New observations at 23, 43, and 86 GHz were carried out at ten epochs between 2017 and 2019. We calibrated the 30 datasets using the rPicard pipeline, imaged them in Difmap, and carried out polarization calibration using the GPCAL pipeline. We complemented our VLBI data by 43 GHz observations carried out in the framework of the BEAM-ME and VLBA-BU-BLAZAR monitoring programs.
Results. We find multiple distinct component paths in the inner jet, which together have a helical geometry. The helix appears to be anchored at a stationary feature some 0.16 mas from the 43 GHz VLBI core and has an evolution timescale of about 8 yr. The characteristic bends in the jet morphology are caused by variations in the component ejection angle. We confirm the result of previous studies: the γ-ray emission is caused by relativistic outflow and violent interactions within the jet.
Key words: black hole physics / relativistic processes / instrumentation: interferometers / galaxies: jets / quasars: general / quasars: individual: 3C345
Full Table A.1 is available at the CDS via anonymous ftp to cdsarc.cds.unistra.fr (130.79.128.5) or via https://cdsarc.cds.unistra.fr/viz-bin/cat/J/A+A/684/A211
Member of the International Max Planck Research School (IMPRS) for Astronomy and Astrophysics at the Universities of Bonn and Cologne.
© The Authors 2024
 Open Access article, published by EDP Sciences, under the terms of the Creative Commons Attribution License (https://creativecommons.org/licenses/by/4.0), which permits unrestricted use, distribution, and reproduction in any medium, provided the original work is properly cited.
This article is published in open access under the Subscribe to Open model.
Open access funding provided by Max Planck Society.
1. Introduction
In recent years, very long baseline interferometry (VLBI) observations with a variety of telescope arrays have enabled us to study the formation and evolution of relativistic jets in great detail (e.g., Kim et al. 2020b; Issaoun et al. 2022; Jorstad et al. in prep.; Lee 2013, 2014; Lee et al. 2016a,b; Nair et al. 2019). The flat-spectrum quasar 3C 345 is one of the most extensively studied active galactic nuclei (AGN; e.g., Wittels et al. 1976a,b; Shapiro et al. 1979; Biretta et al. 1983, 1986; Cohen et al. 1981, 1983; Unwin & Wehrle 1992; Zensus et al. 1995; Gabuzda et al. 1999; Klare et al. 2001; Lobanov & Zensus 1999; Lobanov & Roland 2005; Ros et al. 2000; Schinzel et al. 2011). 3C 345 is monitored in the MOJAVE 15 GHz (Lister et al. 2021), VLBA–BU–BLAZAR & BEAM–ME 43 GHz, and SMA calibrator 230 GHz programs (Gurwell et al. 2007), as well as by the Fermi/LAT gamma ray telescope (Kocevski & Fermi Large Area Telescope Collaboration 2021; Abdollahi et al. 2023).
At radio frequencies, 3C 345 is known to show a characteristic core-jet structure, with a notable persistent bend that changes the jet direction from the west to the northwest at some 4 mas from the core (Schinzel et al. 2010). The compact jet between the central engine and the northward bend consists of both stationary and moving shocks with transverse magnetic field orientations.
The downstream shocks are frequently observed moving at apparent superluminal speeds (e.g., Zensus et al. 1995; Lister et al. 2019, 2021; Weaver et al. 2022) and show a typical transverse magnetic field, as expected from shock compression. At 15 GHz, the magnetic field is longitudinal, indicative of a shear layer that is resolved out at higher frequencies (see Sect. 3.7). The VLBI core keeps its transverse magnetic field in this frequency range. Lobanov & Zensus (1999) postulated a ∼7.5 yr activity cycle for 3C 345, which for the most part has resulted in somewhat accurate predictions of flares.
The relativistic parsec-scale outflow has been identified as a source of the observed γ-ray emission in 3C 345 (Schinzel et al. 2011, 2012), as have other AGN (MacDonald et al. 2017; Angioni et al. 2019, 2020; Kim et al. 2020a, 2022; Rösch et al. 2022). Specifically, Schinzel et al. (2012) showed a correlation between a newly ejected component passing through a stationary feature near the 43 GHz core as well as a spike in the γ-ray flux. This discovery prompted the proposal for the multifrequency follow-up observations analyzed in this paper.
Following Pötzl et al. (2021), we adopted a flat Λ cold dark matter cosmology where ΩM = 0.3, ΩΛ = 0.7, and H0 = 70 km s−1 Mpc−1. At a redshift z = 0.593, this yields a linear scale of 6.65 pc mas−1 and a proper motion scale of 1 mas yr−1, which corresponds to 34.5 c. This paper is organized as follows: in Sect. 2, the multifrequency VLBA observations and data reduction are described. Section 3 is split into an analysis of the total intensity jet morphology, its kinematics, its polarized structure, and a discussion on the origin of the γ-ray emission. We discuss and summarize our results in Sect. 4.
2. Observations, calibration, and imaging
The VLBA campaigns BS260 and BS263 respectively took place on four observing days between June 27 and September 26, 2017, and six days between February 12 and August 28, 2018. The quasars 3C 345 and 3C 279 were observed at central frequencies of 23.7, 43.2 and 86.0 GHz, along with the two calibrator sources J1310+3233 and J1407+2827 at the two lower frequencies.
The sources were observed with the whole VLBA with stations in Brewster (BR), Fort Davis (FD), Hancock (HN), Kitt Peak (KP), Los Alamos (LA), North Liberty (NL), Owens Valley (OV), Pie Town (PT), Saint Croix (SC), and Mauna Kea (MK). Missing antennas for each epoch are reported in Table A.2, such as the SC downtime between 2017 and 2018 due to hurricane damage. The data were recorded in two subbands (intermediate frequency channels) of 128 MHz bandwidth for both left-hand circular and right-hand circular polarization, and correlated at the VLBA correlator. An overview of the observations is given in Table A.2.
The data were calibrated in total intensity using the CASA-based pipeline rPicard (Janssen et al. 2019) and subsequently imaged in Difmap (Shepherd 1997). Furthermore, we used the AIPS-based pipeline GPCAL (Park et al. 2021) and the AIPS tasks IMAGR, COMB, and PCNTR (Greisen 2003) to calibrate and image the polarized emission. Due to the lack of a calibrator source, we are unable to reliably calibrate the electric vector position angle (EVPA). The 86 GHz data are very noisy in some epochs, making polarization calibration infeasible and allowing only for Gaussian model fitting.
We complemented this VLBA dataset with 87 epochs at 43 GHz taken from the VLBA-BU-BLAZAR and BEAM-ME programs, the first 46 of which are reported in Weaver et al. (2022). Lastly, all γ-ray data are taken from the Fermi Large Area Telescope γ-ray light curve repository (Kocevski & Fermi Large Area Telescope Collaboration 2021; Abdollahi et al. 2023)1.
3. Results and discussion
3.1. Total intensity jet structure
Our new observations taken between 2017 and 2019 probe the innermost few milliarcseconds of the 3C 345 radio jet. Figure 1 shows exemplary total intensity CLEAN maps between 5 and 86 GHz observed in May 2018, the month with the highest VLBI frequency coverage. The 5 GHz observation took place on May 4 and was taken from the VLBA archive; the 15 GHz MOJAVE image was observed on May 31, and the 23–86 GHz data were observed on May 18.
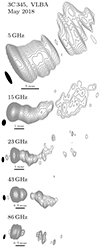 |
Fig. 1. CLEAN images of the total intensity radiation in the jet of 3C 345 at 5, 15, 23, 43, and 86 GHz, in uniform weighting. The restoring beam is shown in the bottom-left corner of each image as a black ellipse. Contour levels increase as n × 2(i − 2)/2 × Speak for i = 1, 2, ... and n = {3, 3, 5, 5, 10}×10−3 for each respective frequency. The 15 and 23 GHz images have the same spatial scale, as do the 43 and 86 GHz images. |
The total intensity morphology reveals a knotty jet on milliarcsecond scales, which undergoes a northward bend some 5 mas from the 15 GHz VLBI core. We modeled the compact jet with circular Gaussian components using the Difmap task MODELFIT (Pearson et al. 1994). At 43 GHz, the core, two stationary components, S1 and S2, as well as seven moving jet components can be robustly identified in multiple consecutive epochs; the two stationary features are not distinguishable at 23 GHz. Between 43 GHz and 23 GHz, components S1, Q1, and Q3–Q5 can be robustly cross-identified for more than three epochs. Component positions at 23, 43, and 86 GHz of the new observations are listed in Table A.1 for Q4; the full table, which includes all other components, is available at the CDS.
The central 0.5 mas at 43 GHz are well described by the (usually) easternmost component, which we label the “core”, in agreement with previous studies (Schinzel et al. 2012; Weaver et al. 2022), together with stationary components S1 and S2. For the first six epochs, S1 is the brightest feature instead of the 43 GHz core; the latter becomes the brightest feature some time before May 18, 2018, upon ejection of a new component.
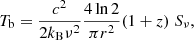
The radial separation of Gaussian components at 43 GHz with time is shown in Fig. 2 in an extended time range between mid-2015 and mid-2023. Here, we improved the time sampling at 43 GHz using model fits from Weaver et al. (2022), shown together with the results from the observations described above.
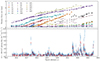 |
Fig. 2. Core separation of robustly detected components in the 3C 345 jet at 43 GHz. The model fits from this study and Weaver et al. (2022) are shown in the top panel. They are approximated by linear fits together to increase the robustness of the fits for the components identifiable across multiple frequencies. Fit results are given in Table A.3. Fermi/LAT γ-ray activity in weekly (red) and three-day (blue) binning are shown in the bottom panel. The ejection of Q21, Q2, and Q23 has a γ-ray counterpart in mid-2017, while the later activity cannot be identified with a clear-cut ejection event. |
3.2. Jet kinematics
Out of the eight persistent components mentioned in Sect. 3.1, we identify two stationary (S1 and S2) and seven superluminally moving components, similar to early VLBI studies of 3C 345 (e.g., Zensus et al. 1995; Schinzel et al. 2012; Pötzl et al. 2021) and similar sources. Newly ejected components appear to pass through S2, appearing blended with it until they are separated far enough from the central engine. This leads to an ambiguity in the identification of Gaussian components and, in turn, to uncertainty whether or not new components are accelerating. For example, Schinzel et al. (2012) identified accelerating components during the 2009 γ-ray flare; however, Weaver et al. (2022) show those same components to move linearly instead.
Since the time sampling at 43 GHz exceeds that of the other frequencies by at least a factor of three, we carried out the kinematic analysis at 43 GHz only. The apparent speeds of the moving components are summarized in Table A.3. In good agreement with Weaver et al. (2022), we find very high apparent velocities of ∼14–18 c in the jet due to the very small viewing angle in 3C 345. In fact, deprojecting the apparent speed βapp as (Schinzel et al. 2012)
 (1)
(1)
and minimizing with respect to the viewing angle, θ, the deprojected speed is βdepr ≳ 0.998 for βapp > 16, and θ ≲ 3.4°.
The downstream components between 2017 and 2019 move along two distinct paths in the jet. Specifically, Q1 and Q2 follow the path of Q3 and Q4 past ejection, while Q5 and Q6 travel along a parallel track farther south. We put this result into context with the long-term evolution by over-plotting the component positions obtained by Weaver et al. (2022) between June 2017 and January 2019 onto a stacked 43 GHz image of the same time range, shown in Fig. 3. The stationary features S1 and S2 are respectively shown in black and magenta to distinguish them from the moving components, shown color coded by the time of observation. The core is marked with a black cross.
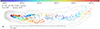 |
Fig. 3. Long-term evolution of on-sky positions of model fit components. The component positions have been adjusted such that the core is located at the origin at all epochs. The background map is a stacked image of all epochs the components are taken from, restored with a 0.2 mas circular beam, shown as a gray circle in the bottom-left corner. We restrict the time range to better illustrate the maxima of the jet slewing. |
Each newly ejected component starts its journey from an on-sky position coinciding with that of S2. Past this point, the stacked image jet opens up with a profile defined by the paths of moving components. While individual epochs tend to show a source morphology comparable to the 43 GHz panel in Fig. 1, the stacked image reveals the underlying structure of the jet. It is hence evident that at any point in time, only some illuminated parts of the jet are visible. Therefore, the characteristic milliarcsecond scale bends are not, in fact, “true” bends, but merely a consequence of components ejected in different directions traveling downstream in a given constellation.
Between mid-2007 and ∼2015, the jet completes about half of one slewing cycle, covering the entire “true” jet cross section with ejected components that continue to travel on curved paths. This behavior is broadly consistent with the ∼7.5 yr activity cycle in 3C 345 predicted by Lobanov & Zensus (1999). The slewing is anchored at or before the second stationary feature S2 at a mean position of 0.16 mas (1 pc projected distance) from the core (Weaver et al. 2022). Assuming a viewing angle θ ∼ 3°, the region showing discernible component paths extends from ∼20 pc to ∼380 pc deprojected distance from the central engine.
From the stacked image, it remains unclear whether the jet actually re-collimates at ∼2.5–3 mas from the 43 GHz core, or if the apparent motion in a single funnel past this point is mimicked by sufficiently adiabatically expanded components. Indeed, model fit components past ∼2.5 mas commonly reach full widths at half maximum (FWHMs) in excess of 1 mas, filling out the jet cross section at these scales, catching the faint extended emission. However, Schinzel et al. (2010) also identify components to be moving on multiple paths beyond the sharp northward bend most visible at 15 GHz a few milliarcseconds from the core.
The consistent movement of components over long periods of time supports a helical jet structure in 3C 345. Such geometries have been observed in a large number of AGN jets (see, e.g., Reid et al. 1989; Owen et al. 1989; Zensus et al. 1995; Steffen et al. 1995; Zensus 1997; Ostorero et al. 2004). They may be caused by instabilities in the flow (Fuentes et al. 2023; Nikonov et al. 2023), jet precession (Lu 1990; Britzen & Zajaček 2023; von Fellenberg et al. 2023), or even be the signature of a binary black hole in the central engine (Villata & Raiteri 1999; Lobanov & Roland 2005). Taken by themselves, the data presented in this paper clearly indicate a curved morphology that changes somewhat periodically in time. Together with the magnetic field structure (see Sect. 3.7) and the results obtained in previous studies, this provides strong evidence for a helical jet flow.
3.3. Brightness temperatures
We estimated the brightness temperature, Tb, as
 (2)
(2)
where Sν and r the component flux density in Jy and radius in mas, respectively. Since this prescription differs from that used by Weaver et al. (2022) by a multiplicative factor, we reevaluated their Tb results for our analysis. Figure 4 shows the brightness temperature evolution of the robust components at 43 GHz with increasing on-sky distance from the VLBI core.
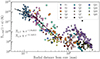 |
Fig. 4. Brightness temperature evolution with apparent core separation of robustly detected components in the 3C 345 jet at 43 GHz. Results from the 43 GHz observations from the multiwavelength dataset discussed in this paper are shown together with results obtained by Weaver et al. (2022) as well as model fits of the BEAM-ME project epochs from 2018 to 2023. The linear fits (black lines) approximate regions below and above a “break” marking the transition from the Compton- to the synchrotron-dominated losses at 0.16 mas from the VLBI core, the average position of S2 (Weaver et al. 2022). The fits yield Tb, C = r−1.8 ± 0.5 and Tb, S = r−4.1 ± 0.3. We exclude unreasonably high brightness temperatures above 5 × 10¹² K. |
We approximated the data with a broken power law below and above the average position of S2 at 0.16 mas from the core (Weaver et al. 2022), yielding slopes of −1.9 ± 0.5 and −4.4 ± 0.3, respectively. Taking into account the large scatter in the brightness temperature, partly caused by small component sizes in some epochs, we confirm the result obtained by Schinzel et al. (2012): up until the second stationary feature, the jet is dominated by Compton losses, and synchrotron losses take over beyond that point. For a straight jet, the slope would soften lightly toward the end of the synchrotron stage to make way for adiabatic expansion to dominate radiative losses. However, in 3C 345 the data points start to scatter heavily around 1 mas from the core, where the helical paths in the jet cross for the first time after the initial jet opening (see Fig. 3).
3.4. Origin of the γ-ray emission
Schinzel et al. (2012) have shown that relativistic outflow accounts for at least parts of the observed γ-ray emission. Specifically, they pinpointed the emission site to the component closest to the 43 GHz VLBI core, which we confirm to be Compton-loss dominated. Since the flare of 2009 was coinciding with the ejection of multiple new components into the jet, one may suspect a shock-shock interaction scenario to be the underlying cause of the γ-ray emission. This would imply a spike in the γ-rays once a newly formed component passes through a stationary feature, which are commonly identified to be standing shocks. However, Fig. 2 shows that the connection of increased γ-ray activity and radio jet evolution is not as clear-cut: For example, the gamma spike in mid-2017 is small, but appears to correspond to three components crossing a standing feature close in time. In contrast, the ejection event in mid-2016 appears to not have any γ-ray counterpart, while the much higher gamma activity between 2021 and 2023 does not seem to correspond to the ejection of any individual component.
Between November 2021 and November 2022, a feature comparable in size to the VLBI core slowly separates from it, shown on the right side of Fig. 5. The accuracy of the model fit during that time is heavily decreased. It is likely that during this event, different parts of the jet violently interact with each other, producing the extreme γ-ray activity. The feature is also highly polarized and governed by a transverse magnetic field, indicating that it consists of moving shocks like the other traveling components. It is unclear which interaction between the components is causing the extreme γ-ray activity, shown on the left side of Fig. 5.
 |
Fig. 5. Fermi/LAT γ-ray light curve (left panel) and 43 GHz VLBI total intensity maps taken from the BEAM-ME project (right panels). Circular Gaussian model fit components are overplotted as black circles or black crosses depending on their size. The VLBI maps are aligned to the model fit core. |
3.5. Core shift
For a classical Blandford-Königl AGN jet, the position of the optically thick VLBI core with respect to the optically thin jet depends on the observing frequency; hence, the core appears displaced when overlaying images of the same jet at two different frequencies. The magnitude of this core shift is a measure of the system’s deviation from equipartition, that is to say, whether a larger portion of the total energy is stored in the magnetic field or in the particles. The core position depends on the frequency as  (Konigl 1981), where for a system in equipartition between magnetic and particle energy, kr = 1. The magnetic field and the particles respectively dominate for kr > 1 and kr < 1.
In order to determine the core shift, we first masked the optically thick core region in two maps with the same pixel size, restored with the same beam. Then, we Fourier-aligned the images via 2D cross-correlation.
In May 2018, the frequency coverage is sufficient to perform a power-law fit to the VLBI core positions from 5 to 86 GHz. Defining an offset Ωrν, the true core position reads (Lobanov 1998)
![Mathematical equation: $$ \begin{aligned} r_{\rm core}(\nu )=\Omega _{r\nu } \left[ \nu ^{1/k_r} \sin \theta \right]^{-1}. \end{aligned} $$](/articles/aa/full_html/2024/04/aa49038-23/aa49038-23-eq4.gif) (3)
(3)
We fit Eq. (3) to the obtained core shifts in May 2018 solving for the prefactor Φ = Ωrν/sin θ and exponent kr as rc ∼ Φ × ν−1/kr.
Figure 6 shows the radial core shift at a given frequency with respect to the 86 GHz map. The 5/15 GHz pair is set to a 0.02 mas pixel size and is convolved with a 1.6 mas beam, whereas the maps in all other frequency pairs are set to 0.01 mas pixels and a 0.4 mas beam. The shifts are then obtained using the masking and alignment procedure described above. The power-law fit yields kr ≃ 1.4, implying a magnetically dominated jet.
 |
Fig. 6. Radial core shift measurement in the May 2018 epoch with respect to the core at 86 GHz, based on the total intensity maps shown in Fig. 1. |
During the period from 2017–2019, we studied the evolution of the core shift between 23 and 43 GHz. In the third epoch of our multifrequency observations, the core shift drops from the mean value |Δr|=(0.055 ± 0.019) mas down to 0.028 mas, corresponding to the ejection of three radio features and a spike in the γ-ray emission during that time frame (see Fig. 2). The scatter around the mean in the other, quiescent epochs, is likely caused by uncertainties in the alignment.
3.6. Spectral index
We obtained spectral index maps from the total intensity maps for each epoch between 23 and 43 GHz (α23 − 43), adopting the definition S ∝ να and accounting for the core shift.
Since the VLBA has been known to have issues in total flux calibration in recent years2, we re-scaled the total intensity maps to fit the single-dish spectral index at corresponding epochs using the Owens Valley Radio Observatory (OVRO) 15 GHz and Metsähovi 37 GHz light curves. The 23 GHz maps were up-scaled by ∼25%, while the 43 GHz maps require a multiplicative factor of 1.40 on the visibility amplitudes. Satisfactory spectral index maps between 43 GHz and 86 GHz cannot be obtained, since the correct scaling factor for the 86 GHz data cannot be reliably determined (scaling to ALMA band 3 flux densities would yield scaling of a factors of four or more, likely influenced by extended emission that is resolved out in VLBI). Additionally, only very little jet structure is recovered at 86 GHz, hindering image alignment via 2D cross-correlation.
Between 23 GHz and 43 GHz, the core shows a flat or lightly inverted spectrum (α23 − 43 ∼ 0.25). In the jet, generally α23 − 43 ≲ 0; for some epochs, the jet edges partly show inverted spectra, which may be identified as artifacts due to the post-imaging flux scaling.
Figure 7 shows an exemplary spectral index map between 23 GHz and 43 GHz on May 18, 2018. At ∼1 mas from the core, the spectral index maps show a consistent, stationary minimum. The 23 GHz jet appears continuous, but is very faint at 43 GHz and even shows a gap in some epochs (see Fig. 1). This gap apparently coincides with a break in the brightness temperature evolution along the jet at 43 GHz as described above (see Fig. 4). The long-term evolution (see Fig. 3) reveals that the helical paths of ejected components appear to cross at this distance from the core, indicating that the flux density in this region may be decreased at 43 GHz due to a change in viewing angle.
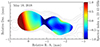 |
Fig. 7. Spectral index map between 23 GHz (in contours) and 43 GHz for a selected epoch. Both maps are restored with a 0.4 mas FWHM circular beam. |
This also supports a picture consistent with Sect. 3.7: at observing frequencies ≲15 GHz, for the most part, we are probably looking at the “outer envelope” of the jet. At frequencies ≳43 GHz, with a transition somewhere in between, the radiation permeates this envelope and reveals the structure of the inner jet. While in the case of a steady jet this may reveal a form of “spine”, possibly in the form of an edge brightening toward higher frequencies, for a jet as knotty as the one in 3C 345 it instead allows us to follow the paths of moving features within the jet.
The region around the bend between 1 and 2 mas from the core shows a moderate spectral index of ∼–0.5, as is usually expected in AGN jets. Toward the jet edges, the index generally slightly increases. This may be indicative of a shear layer that is visible at 23 GHz and is resolved out at higher frequencies, revealing the traveling shocks inside the jet.
3.7. Polarized structure
At 23, 43, and 86 GHz, the polarized maximum is located near that of the total intensity map, with a small downstream displacement toward the stationary components S1 and S2 (see Fig. 8). For a given epoch, the total polarized intensity decreases monotonously with decreasing frequency. While at 23 GHz the polarized maximum reaches 400 mJy beam−1, at 86 GHz it reaches about one tenth of that. Out of the traveling components, Q4 and Q5 show low, but consistently recovered polarization of ≲50 mJy beam−1 at 23 GHz and 43 GHz. This 43 GHz structure even carries over to stacked images of the source (MacDonald et al. 2017).
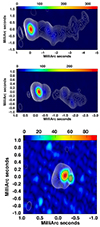 |
Fig. 8. Total (contours) and polarized intensity (color map, in mJy beam−1) on May 18, 2018. The base contour levels are 0.005 for 23 and 43 GHz (top and middle panels), and 0.02 for 86 GHz (bottom panel). The polarized maximum is consistently displaced from the total intensity maximum and instead coincides with the positions of the stationary features. In the lower two frequencies, the left and middle of the moving shocks around 1 to 1.5 mas from the core are weakly polarized. |
In the three MOJAVE 15 GHz epochs between 2017 and 2019, 3C 345 shows a fractional linear polarization m ≲ 0.1 up until ∼10 mas from the core. In some downstream regions starting at ∼5 mas, m ≲ 0.3 is reached at the jet edges. The EVPAs start off parallel to the core, but abruptly change their orientation from the jet base outward. Comparing to the 43 GHz morphology, the core retains its transverse magnetic field across frequencies. The traveling downstream shocks, however, no longer show a transverse field at 15 GHz as they do at 43 GHz and as expected from shock compression (Laing 1980; Hughes et al. 1985). This indicates the presence of a shear layer between the jet and the ambient medium seen at 15 GHz that is resolved out at higher frequencies.
4. Summary, conclusions, and outlook
In this work we have analyzed ten epochs of VLBA observations at 22, 43, and 86 GHz of the famous quasar 3C 345, complemented by 87 epochs at 43 GHz taken from the VLBA-BU-BLAZAR and BEAM-ME programs. The bent compact jet of 3C 345 consists of two stationary and six superluminally moving components that can be identified across epochs and frequencies between 2017 and 2019.
– The innermost ∼0.6 mas of the 43 GHz jet are dominated by Compton and synchrotron losses; the transition is marked by a stationary feature some 0.16 mas from the core.
– The long-term 43 GHz evolution reveals components moving on helical paths in the jet. Points at which the paths apparently cross appear faint, causing a steep spectral index and a flux density gap in the total intensity images.
– The γ-ray emission partly coincides with the ejection of new jet components, but can also be related to less specific but extreme changes in the jet morphology, as can be seen during the period of high γ-ray activity from 2021 to 2023.
– In the quiescent May 2018 epochs, the core shift indicates a magnetically dominated jet.
– Long-term component tracking shows that the characteristic bent jet represents the part of the jet illuminated by moving components at a given time of observation, rather than a “true” bend in the flow caused by external factors. The stacked image reveals the full jet cross section.
– The polarization structure in conjunction with the component movement at 43 GHz indicates that mostly an outer sheath of the jet is observed up to ∼23 GHz, which is resolved out when moving to higher frequencies. Specifically, at 15 GHz the EVPA pattern suggests an interaction with the ambient medium, whereas the 43 GHz polarization structure reveals an EVPA (and magnetic field) structure consistent with the moving shocks.
Acknowledgments
We thank Luca Ricci, Petra Benke, Manel Perucho and Christian Fromm for their support in discussions on the results, and Phil Hughes in his role as the journal referee. J.R. received financial support for this research from the International Max Planck Research School (IMPRS) for Astronomy and Astrophysics at the Universities of Bonn and Cologne. This research is supported by the European Research Council advanced grant “M2FINDERS – Mapping Magnetic Fields with INterferometry Down to Event hoRizon Scales” (Grant No. 101018682). The VLBA is an instrument of the National Radio Astronomy Observatory. The National Radio Astronomy Observatory is a facility of the National Science Foundation operated by Associated Universities, Inc. This study makes use of VLBA data from the VLBA-BU Blazar Monitoring Program (BEAM-ME and VLBA-BU-BLAZAR; http://www.bu.edu/blazars/BEAM-ME.html), funded by NASA through the Fermi Guest Investigator Program. Software: AIPS (http://www.aips.nrao.edu/index.shtml) (Greisen 2003), Difmap (https://www.cv.nrao.edu/adass/adassVI/shepherdm.html) (Shepherd 1997), ehtim (https://achael.github.io/eht-imaging/) (Chael et al. 2018).
References
- Abdollahi, S., Ajello, M., Baldini, L., et al. 2023, ApJS, 265, 31 [NASA ADS] [CrossRef] [Google Scholar]
- Angioni, R., Ros, E., Kadler, M., et al. 2019, A&A, 627, A148 [NASA ADS] [CrossRef] [EDP Sciences] [Google Scholar]
- Angioni, R., Ros, E., Kadler, M., et al. 2020, A&A, 641, A152 [NASA ADS] [CrossRef] [EDP Sciences] [Google Scholar]
- Biretta, J. A., Cohen, M. H., Unwin, S. C., & Pauliny-Toth, I. I. K. 1983, Nature, 306, 42 [CrossRef] [Google Scholar]
- Biretta, J. A., Moore, R. L., & Cohen, M. H. 1986, ApJ, 308, 93 [CrossRef] [Google Scholar]
- Britzen, S., Zajaček, M., Gopal-Krishna, et al. 2023, ApJ, 951, 106 [CrossRef] [Google Scholar]
- Chael, A. A., Johnson, M. D., Bouman, K. L., et al. 2018, ApJ, 857, 23 [Google Scholar]
- Cohen, M. H., Unwin, S. C., Simon, R. S., et al. 1981, ApJ, 247, 774 [NASA ADS] [CrossRef] [Google Scholar]
- Cohen, M. H., Unwin, S. C., Lind, K. R., et al. 1983, ApJ, 272, 383 [NASA ADS] [CrossRef] [Google Scholar]
- Fuentes, A., Gómez, J. L., Martí, J. M., et al. 2023, Nat. Astron., 7, 1359 [NASA ADS] [CrossRef] [Google Scholar]
- Gabuzda, D. C., Mioduszewski, A. J., Roberts, D. H., & Wardle, J. F. C. 1999, MNRAS, 303, 515 [NASA ADS] [CrossRef] [Google Scholar]
- Greisen, E. W. 2003, in Information Handling in Astronomy - Historical Vistas, ed. A. Heck, Astrophys. Space Sci. Lib., 285, 109 [NASA ADS] [CrossRef] [Google Scholar]
- Gurwell, M. A., Peck, A. B., Hostler, S. R., Darrah, M. R., Katz, C. A., et al. 2007, in From Z-Machines to ALMA: (Sub)Millimeter Spectroscopy of Galaxies, eds. A. J. Baker, J. Glenn, A. I. Harris, et al., ASP Conf. Ser., 375, 234 [NASA ADS] [Google Scholar]
- Hughes, P. A., Aller, H. D., & Aller, M. F. 1985, ApJ, 298, 301 [NASA ADS] [CrossRef] [Google Scholar]
- Issaoun, S., Wielgus, M., Jorstad, S., et al. 2022, ApJ, 934, 145 [NASA ADS] [CrossRef] [Google Scholar]
- Janssen, M., Goddi, C., van Bemmel, I. M., et al. 2019, A&A, 626, A75 [NASA ADS] [CrossRef] [EDP Sciences] [Google Scholar]
- Kim, D.-W., Trippe, S., & Kravchenko, E. V. 2020a, A&A, 636, A62 [EDP Sciences] [Google Scholar]
- Kim, J.-Y., Krichbaum, T. P., Broderick, A. E., et al. 2020b, A&A, 640, A69 [EDP Sciences] [Google Scholar]
- Kim, D.-W., Kravchenko, E. V., Kutkin, A. M., et al. 2022, ApJ, 925, 64 [NASA ADS] [CrossRef] [Google Scholar]
- Klare, J., Zensus, J. A., Krichbaum, T. P., Lobanov, A. P., & Ros, E. 2001, in Galaxies and their Constituents at the Highest Angular Resolutions, ed. R. T. Schilizzi, IAU Symp., 205, 130 [NASA ADS] [Google Scholar]
- Kocevski, D., & Fermi Large Area Telescope Collaboration 2021, ATel, 15110, 1 [Google Scholar]
- Konigl, A. 1981, ApJ, 243, 700 [Google Scholar]
- Laing, R. A. 1980, MNRAS, 193, 439 [NASA ADS] [Google Scholar]
- Lee, S.-S. 2013, J. Korean Astron. Soc., 46, 243 [NASA ADS] [CrossRef] [Google Scholar]
- Lee, S.-S. 2014, J. Korean Astron. Soc., 47, 303 [NASA ADS] [CrossRef] [Google Scholar]
- Lee, S.-S., Lobanov, A. P., Krichbaum, T. P., & Zensus, J. A. 2016a, ApJ, 826, 135 [Google Scholar]
- Lee, S.-S., Wajima, K., Algaba, J.-C., et al. 2016b, ApJS, 227, 8 [Google Scholar]
- Lister, M. L., Homan, D. C., Hovatta, T., et al. 2019, ApJ, 874, 43 [NASA ADS] [CrossRef] [Google Scholar]
- Lister, M. L., Homan, D. C., Kellermann, K. I., et al. 2021, ApJ, 923, 30 [NASA ADS] [CrossRef] [Google Scholar]
- Lobanov, A. P. 1998, A&A, 330, 79 [NASA ADS] [Google Scholar]
- Lobanov, A. P., & Roland, J. 2005, A&A, 431, 831 [NASA ADS] [CrossRef] [EDP Sciences] [Google Scholar]
- Lobanov, A. P., & Zensus, J. A. 1999, ApJ, 521, 509 [Google Scholar]
- Lu, J. F. 1990, A&A, 229, 424 [NASA ADS] [Google Scholar]
- MacDonald, N. R., Jorstad, S. G., & Marscher, A. P. 2017, ApJ, 850, 87 [Google Scholar]
- Nair, D. G., Lobanov, A. P., Krichbaum, T. P., et al. 2019, A&A, 622, A92 [NASA ADS] [CrossRef] [EDP Sciences] [Google Scholar]
- Nikonov, A. S., Kovalev, Y. Y., Kravchenko, E. V., Pashchenko, I. N., & Lobanov, A. P. 2023, MNRAS, 526, 5949 [NASA ADS] [CrossRef] [Google Scholar]
- Ostorero, L., Villata, M., & Raiteri, C. M. 2004, A&A, 419, 913 [NASA ADS] [CrossRef] [EDP Sciences] [Google Scholar]
- Owen, F. N., Hardee, P. E., & Cornwell, T. J. 1989, ApJ, 340, 698 [NASA ADS] [CrossRef] [Google Scholar]
- Park, J., Byun, D.-Y., Asada, K., & Yun, Y. 2021, ApJ, 906, 85 [NASA ADS] [CrossRef] [Google Scholar]
- Pearson, T. J., Shepherd, M. C., Taylor, G. B., & Myers, S. T. 1994, Am. Astron. Soc. Meeting Abstr., 185, 08.08 [NASA ADS] [Google Scholar]
- Pötzl, F. M., Lobanov, A. P., Ros, E., et al. 2021, A&A, 648, A82 [NASA ADS] [CrossRef] [EDP Sciences] [Google Scholar]
- Reid, M. J., Biretta, J. A., Junor, W., Muxlow, T. W. B., & Spencer, R. E. 1989, ApJ, 336, 112 [NASA ADS] [CrossRef] [Google Scholar]
- Ros, E., Zensus, J. A., & Lobanov, A. P. 2000, A&A, 354, 55 [NASA ADS] [Google Scholar]
- Rösch, F., Kadler, M., Ros, E., et al. 2022, in European VLBI Network Mini-Symposium and Users’ Meeting 2021, 1 [Google Scholar]
- Schinzel, F. K., Lobanov, A. P., & Zensus, J. A. 2010, in Accretion and Ejection in AGN: a Global View, eds. L. Maraschi, G. Ghisellini, R. Della Ceca, & F. Tavecchio, ASP Conf. Ser., 427, 153 [NASA ADS] [Google Scholar]
- Schinzel, F. K., Sokolovsky, K. V., D’Ammando, F., et al. 2011, A&A, 532, A150 [NASA ADS] [CrossRef] [EDP Sciences] [Google Scholar]
- Schinzel, F. K., Lobanov, A. P., Taylor, G. B., et al. 2012, A&A, 537, A70 [NASA ADS] [CrossRef] [EDP Sciences] [Google Scholar]
- Shapiro, I. I., Wittels, J. J., Counselman, C. C. I., et al. 1979, AJ, 84, 1459 [NASA ADS] [CrossRef] [Google Scholar]
- Shepherd, M. C. 1997, in Astronomical Data Analysis Software and Systems VI, eds. G. Hunt, & H. Payne, ASP Conf. Ser., 125, 77 [Google Scholar]
- Steffen, W., Zensus, J. A., Krichbaum, T. P., Witzel, A., & Qian, S. J. 1995, A&A, 302, 335 [NASA ADS] [Google Scholar]
- Unwin, S. C., & Wehrle, A. E. 1992, ApJ, 398, 74 [NASA ADS] [CrossRef] [Google Scholar]
- Villata, M., & Raiteri, C. M. 1999, A&A, 347, 30 [NASA ADS] [Google Scholar]
- von Fellenberg, S. D., Janssen, M., Davelaar, J., et al. 2023, A&A, 672, L5 [NASA ADS] [CrossRef] [EDP Sciences] [Google Scholar]
- Weaver, Z. R., Jorstad, S. G., Marscher, A. P., et al. 2022, ApJS, 260, 12 [NASA ADS] [CrossRef] [Google Scholar]
- Wittels, J. J., Cotton, W. D., Counselman, C. C. I., et al. 1976a, ApJ, 206, L75 [NASA ADS] [CrossRef] [Google Scholar]
- Wittels, J. J., Shapiro, I. I., Cotton, W. D., et al. 1976b, AJ, 81, 933 [NASA ADS] [CrossRef] [Google Scholar]
- Zensus, J. A. 1997, ARA&A, 35, 607 [NASA ADS] [CrossRef] [Google Scholar]
- Zensus, J. A., Cohen, M. H., & Unwin, S. C. 1995, ApJ, 443, 35 [Google Scholar]
Appendix A: Supplementary material
Table A.1 shows the obtained fluxes and positions for a representative jet component. Table A.2 provides an overview of the ten multifrequency epochs observed between 2017 and 2019. Total fluxes at 23 and 43 GHz are scaled to the single-dish spectral index between 15 and 37 GHz. Table A.3 lists the derived kinematics from the jet components that could be identified at two different frequencies.
Component positions (extract).
Multifrequency VLBA observations.
Derived physical parameters for the components cross-identified between 23 and 43 GHz components.
All Tables
Derived physical parameters for the components cross-identified between 23 and 43 GHz components.
All Figures
|
Fig. 1. CLEAN images of the total intensity radiation in the jet of 3C 345 at 5, 15, 23, 43, and 86 GHz, in uniform weighting. The restoring beam is shown in the bottom-left corner of each image as a black ellipse. Contour levels increase as n × 2(i − 2)/2 × Speak for i = 1, 2, ... and n = {3, 3, 5, 5, 10}×10−3 for each respective frequency. The 15 and 23 GHz images have the same spatial scale, as do the 43 and 86 GHz images. |
| In the text | |
|
Fig. 2. Core separation of robustly detected components in the 3C 345 jet at 43 GHz. The model fits from this study and Weaver et al. (2022) are shown in the top panel. They are approximated by linear fits together to increase the robustness of the fits for the components identifiable across multiple frequencies. Fit results are given in Table A.3. Fermi/LAT γ-ray activity in weekly (red) and three-day (blue) binning are shown in the bottom panel. The ejection of Q21, Q2, and Q23 has a γ-ray counterpart in mid-2017, while the later activity cannot be identified with a clear-cut ejection event. |
| In the text | |
|
Fig. 3. Long-term evolution of on-sky positions of model fit components. The component positions have been adjusted such that the core is located at the origin at all epochs. The background map is a stacked image of all epochs the components are taken from, restored with a 0.2 mas circular beam, shown as a gray circle in the bottom-left corner. We restrict the time range to better illustrate the maxima of the jet slewing. |
| In the text | |
|
Fig. 4. Brightness temperature evolution with apparent core separation of robustly detected components in the 3C 345 jet at 43 GHz. Results from the 43 GHz observations from the multiwavelength dataset discussed in this paper are shown together with results obtained by Weaver et al. (2022) as well as model fits of the BEAM-ME project epochs from 2018 to 2023. The linear fits (black lines) approximate regions below and above a “break” marking the transition from the Compton- to the synchrotron-dominated losses at 0.16 mas from the VLBI core, the average position of S2 (Weaver et al. 2022). The fits yield Tb, C = r−1.8 ± 0.5 and Tb, S = r−4.1 ± 0.3. We exclude unreasonably high brightness temperatures above 5 × 10¹² K. |
| In the text | |
|
Fig. 5. Fermi/LAT γ-ray light curve (left panel) and 43 GHz VLBI total intensity maps taken from the BEAM-ME project (right panels). Circular Gaussian model fit components are overplotted as black circles or black crosses depending on their size. The VLBI maps are aligned to the model fit core. |
| In the text | |
|
Fig. 6. Radial core shift measurement in the May 2018 epoch with respect to the core at 86 GHz, based on the total intensity maps shown in Fig. 1. |
| In the text | |
|
Fig. 7. Spectral index map between 23 GHz (in contours) and 43 GHz for a selected epoch. Both maps are restored with a 0.4 mas FWHM circular beam. |
| In the text | |
|
Fig. 8. Total (contours) and polarized intensity (color map, in mJy beam−1) on May 18, 2018. The base contour levels are 0.005 for 23 and 43 GHz (top and middle panels), and 0.02 for 86 GHz (bottom panel). The polarized maximum is consistently displaced from the total intensity maximum and instead coincides with the positions of the stationary features. In the lower two frequencies, the left and middle of the moving shocks around 1 to 1.5 mas from the core are weakly polarized. |
| In the text | |
Current usage metrics show cumulative count of Article Views (full-text article views including HTML views, PDF and ePub downloads, according to the available data) and Abstracts Views on Vision4Press platform.
Data correspond to usage on the plateform after 2015. The current usage metrics is available 48-96 hours after online publication and is updated daily on week days.
Initial download of the metrics may take a while.