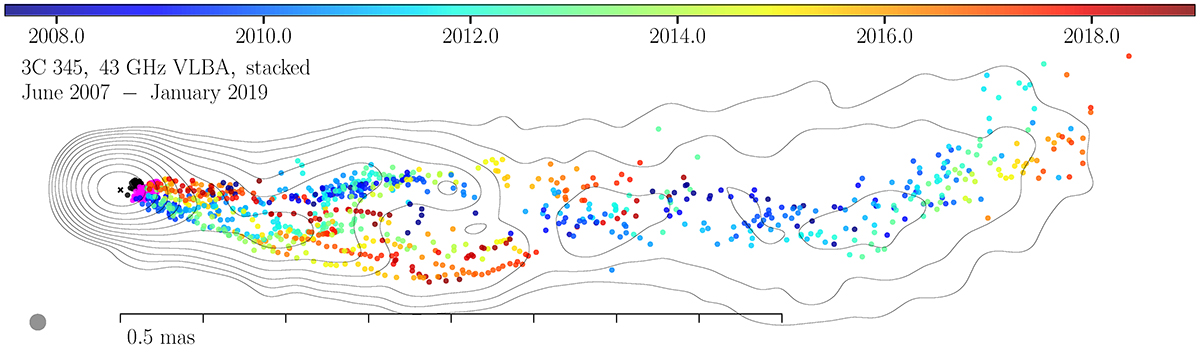
Fig. 3.
Download original image
Long-term evolution of on-sky positions of model fit components. The component positions have been adjusted such that the core is located at the origin at all epochs. The background map is a stacked image of all epochs the components are taken from, restored with a 0.2 mas circular beam, shown as a gray circle in the bottom-left corner. We restrict the time range to better illustrate the maxima of the jet slewing.
Current usage metrics show cumulative count of Article Views (full-text article views including HTML views, PDF and ePub downloads, according to the available data) and Abstracts Views on Vision4Press platform.
Data correspond to usage on the plateform after 2015. The current usage metrics is available 48-96 hours after online publication and is updated daily on week days.
Initial download of the metrics may take a while.