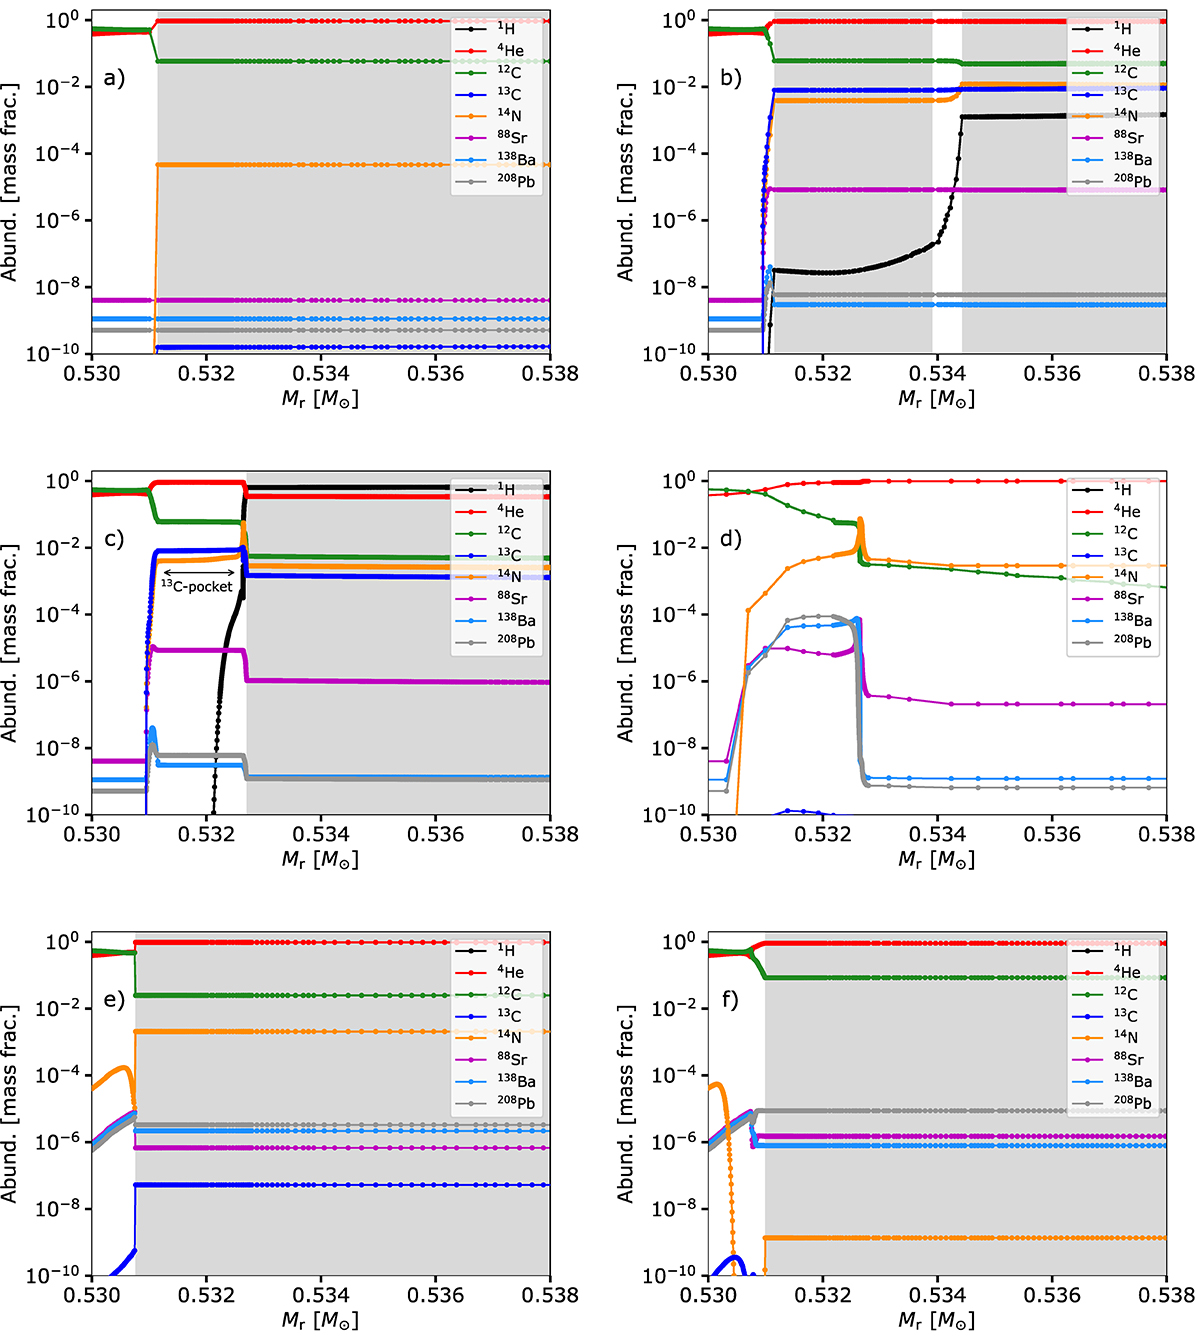
Fig. 8.
Download original image
Abundance profiles of the M2.0z1.0_f10 model before the PIE (model 25344, panel a); right after the PIE (model 26044, panel b); just after the merging between the pulse and envelope (model 26544, panel c); at the end of the interpulse (model 42644, panel d); at the very start of the second thermal pulse (model 43586, panel e); and after the second weak PIE (model 44597, panel f).
Current usage metrics show cumulative count of Article Views (full-text article views including HTML views, PDF and ePub downloads, according to the available data) and Abstracts Views on Vision4Press platform.
Data correspond to usage on the plateform after 2015. The current usage metrics is available 48-96 hours after online publication and is updated daily on week days.
Initial download of the metrics may take a while.