Fig. 7.
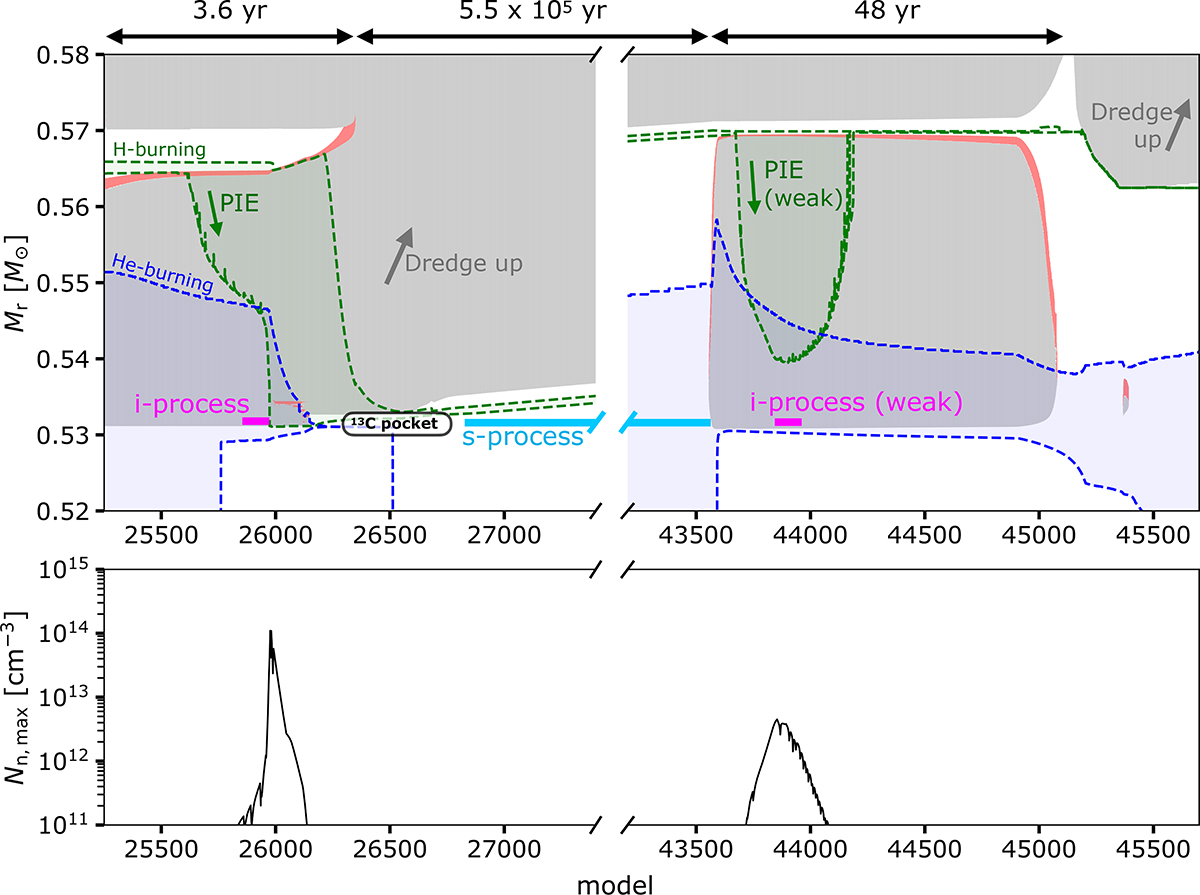
Download original image
Kippenhahn diagram showing the early AGB phase (first and second thermal pulses) of a 2 M⊙, [Fe/H] = −1.0 star (M2.0z1.0_f10 model). Convective regions are shaded gray. The dashed green and blue lines delineate the hydrogen and helium-burning zones, respectively (where the nuclear energy production by H and He burning exceeds 10 erg g−1 s−1). The red area shows the extent of overshooting. The magenta (cyan) line indicates the region zones where the i-process (s-process) nucleosynthesis occurs. The bottom panel shows the maximal neutron density as a function of the model number, or equivalently time as indicated in the upper x-axis.
Current usage metrics show cumulative count of Article Views (full-text article views including HTML views, PDF and ePub downloads, according to the available data) and Abstracts Views on Vision4Press platform.
Data correspond to usage on the plateform after 2015. The current usage metrics is available 48-96 hours after online publication and is updated daily on week days.
Initial download of the metrics may take a while.