Fig. 4.
Download original image
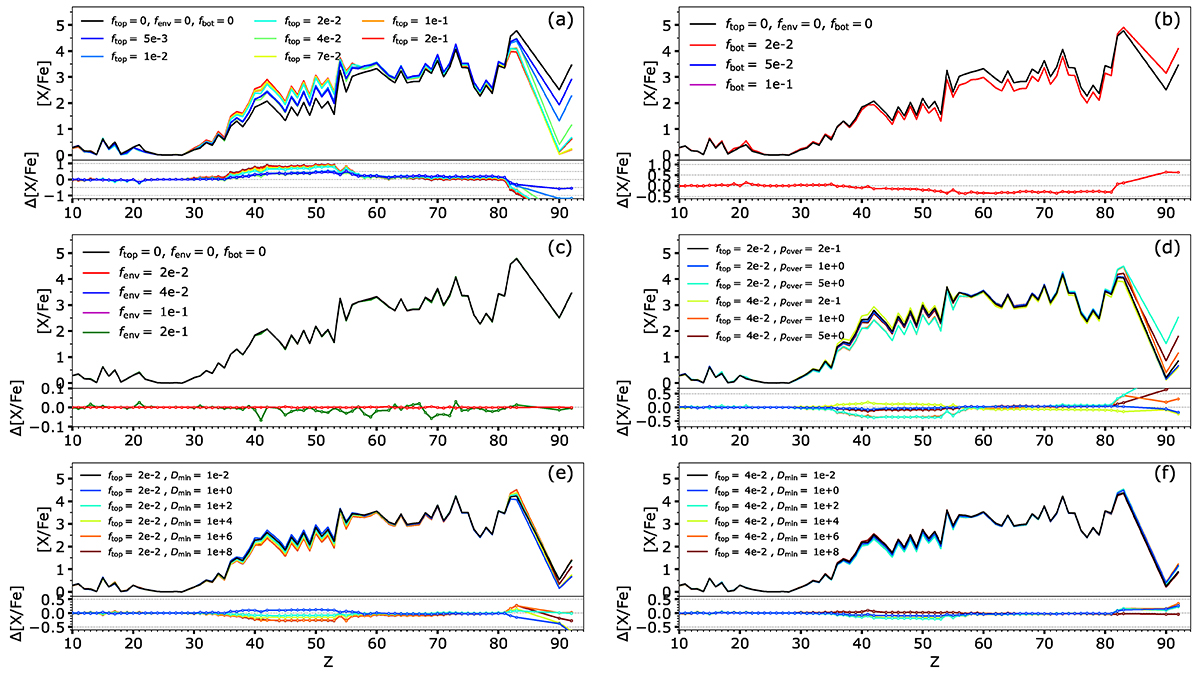
Impact of different overshoot parameters on the surface [X/Fe] ratios after a PIE in a 1 M⊙, [Fe/H] = −2.5 AGB model. Shown are the effect of including overshooting at the top of the convective pulse (panel a), at the bottom of the convective pulse (panel b), at the bottom of the convective envelope (panel c), when varying the parameters p (with ftop = 0.02 and ftop = 0.04, panel d), and Dmin with ftop = 0.02 (panel e), and ftop = 0.04 (panel f). The bottom subplots report the difference between a given model and the first model in the list.
Current usage metrics show cumulative count of Article Views (full-text article views including HTML views, PDF and ePub downloads, according to the available data) and Abstracts Views on Vision4Press platform.
Data correspond to usage on the plateform after 2015. The current usage metrics is available 48-96 hours after online publication and is updated daily on week days.
Initial download of the metrics may take a while.