Fig. A.1.
Download original image
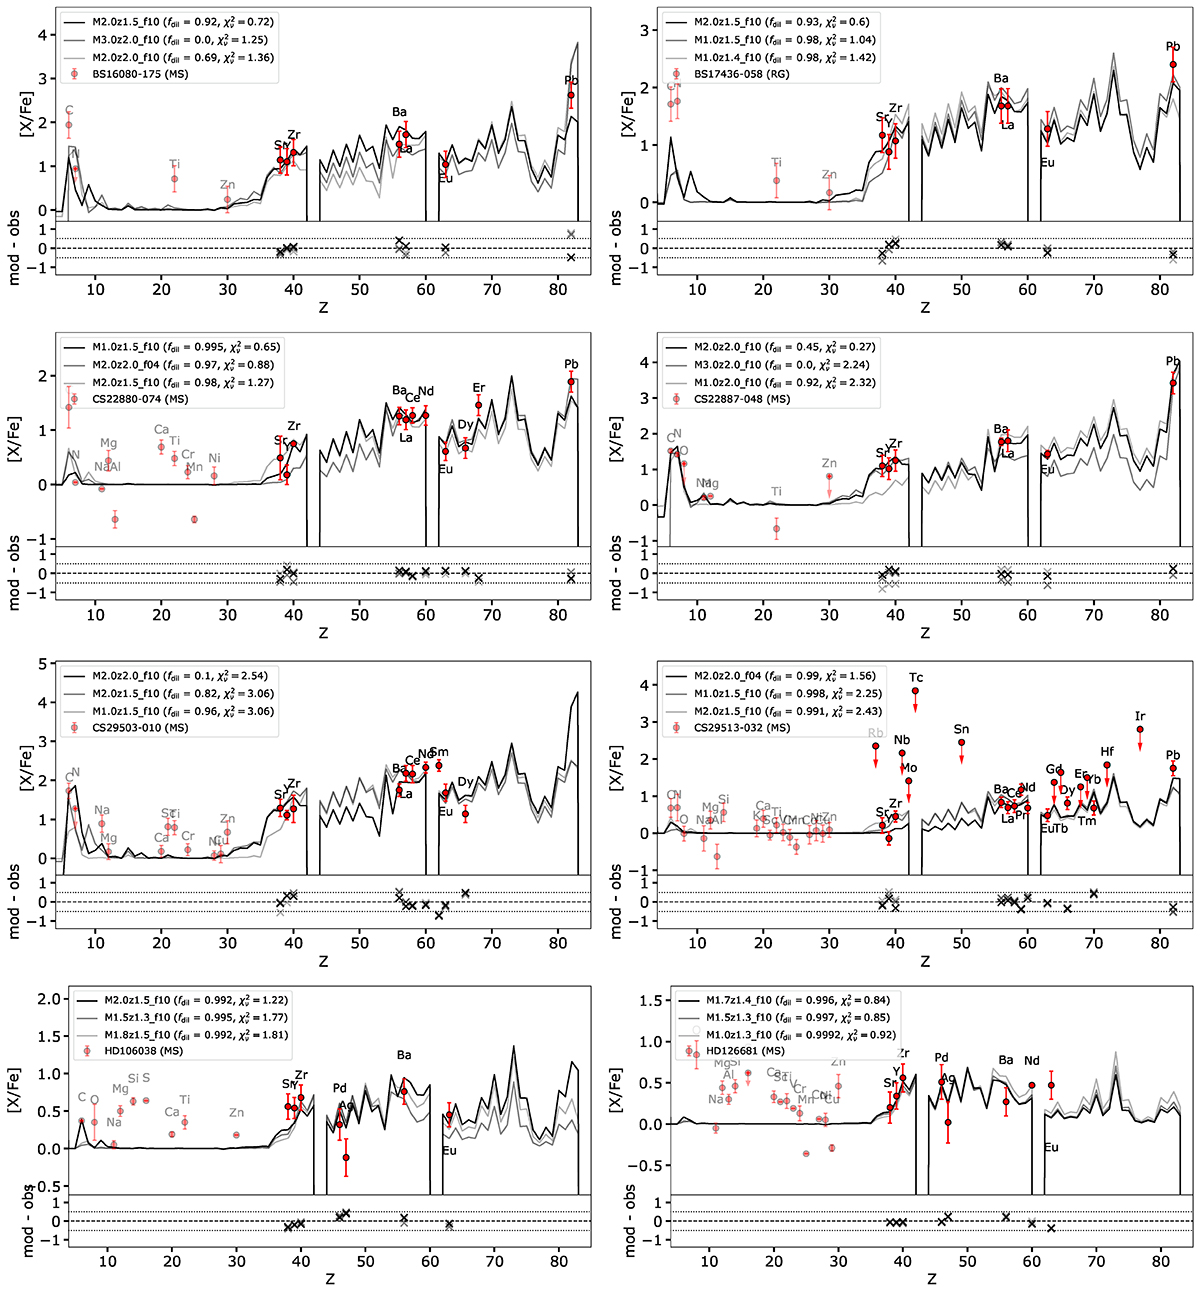
Best fits to the sample stars of Table 4 using the AGB models computed in this work (Table 2). The upper panels compare the [X/Fe] ratios as a function of the charge number Z, while the lower panels gives the deviations between the model and observation. The three best models are shown in black (lowest ![]() ), grey (second lowest
), grey (second lowest ![]() ), and light grey (third lowest
), and light grey (third lowest ![]() ). The dilution factor fdil (Eq. 5) and smallest
). The dilution factor fdil (Eq. 5) and smallest ![]() value are indicated. The abundance data are taken from the SAGA database (Suda et al. 2008), complemented with a few recent observations (see Table 4).
value are indicated. The abundance data are taken from the SAGA database (Suda et al. 2008), complemented with a few recent observations (see Table 4).
Current usage metrics show cumulative count of Article Views (full-text article views including HTML views, PDF and ePub downloads, according to the available data) and Abstracts Views on Vision4Press platform.
Data correspond to usage on the plateform after 2015. The current usage metrics is available 48-96 hours after online publication and is updated daily on week days.
Initial download of the metrics may take a while.