Fig. 15.
Download original image
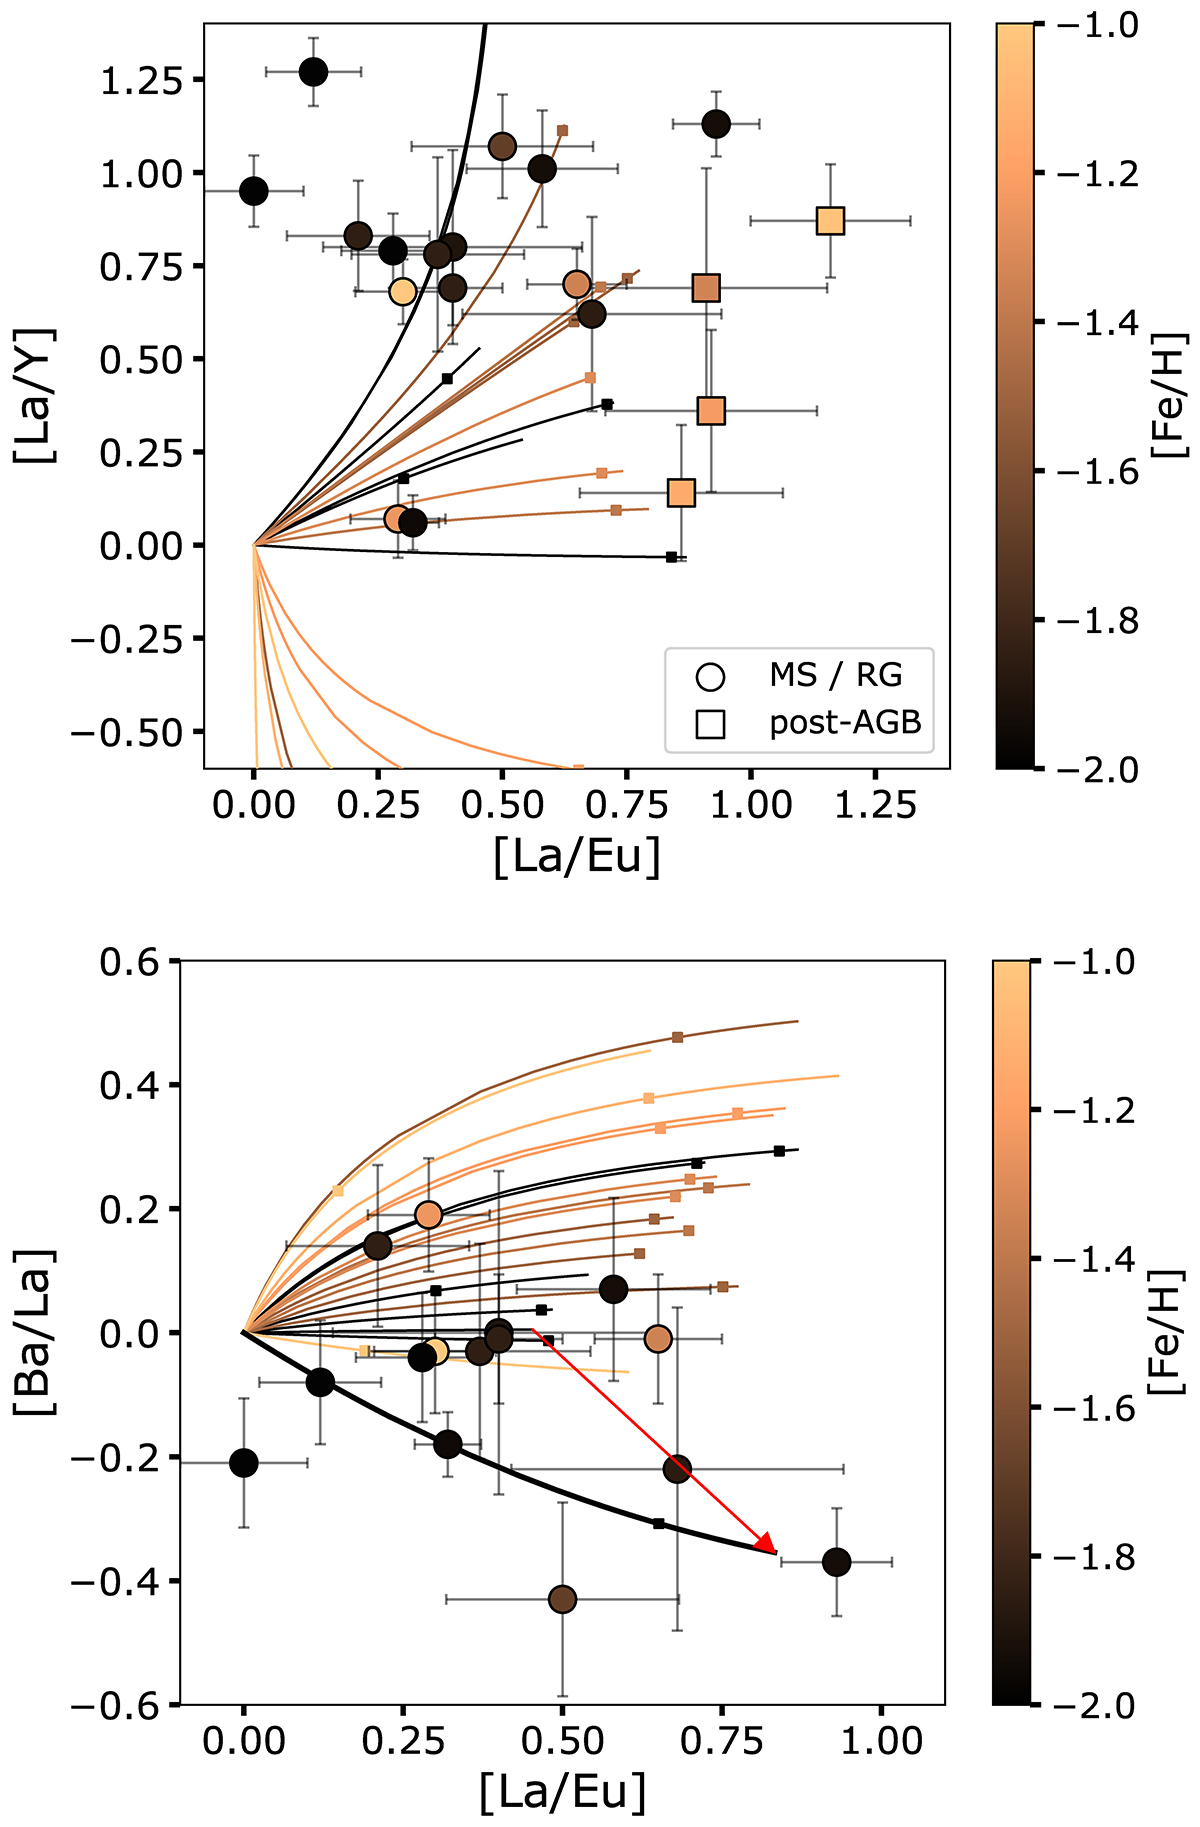
[La/Y] and [Ba/La] abundance ratios as a function of [La/Eu]. Circles correspond to MS and RG stars while squares are for post-AGB stars. Lines represent the dilution curves of the AGB material, which ultimately produce a material of solar composition (i.e., ratios equal to zero). Lines and symbols are color-coded according to the metallicity [Fe/H]. The small squares on the lines indicates where fdil = 0.9. The thick black line (bottom panel) shows a 2 M⊙, [Fe/H] = −2 model computed with a different set of neutron capture rates (see text for more details) and the red arrow shows the resulting abundance displacement.
Current usage metrics show cumulative count of Article Views (full-text article views including HTML views, PDF and ePub downloads, according to the available data) and Abstracts Views on Vision4Press platform.
Data correspond to usage on the plateform after 2015. The current usage metrics is available 48-96 hours after online publication and is updated daily on week days.
Initial download of the metrics may take a while.