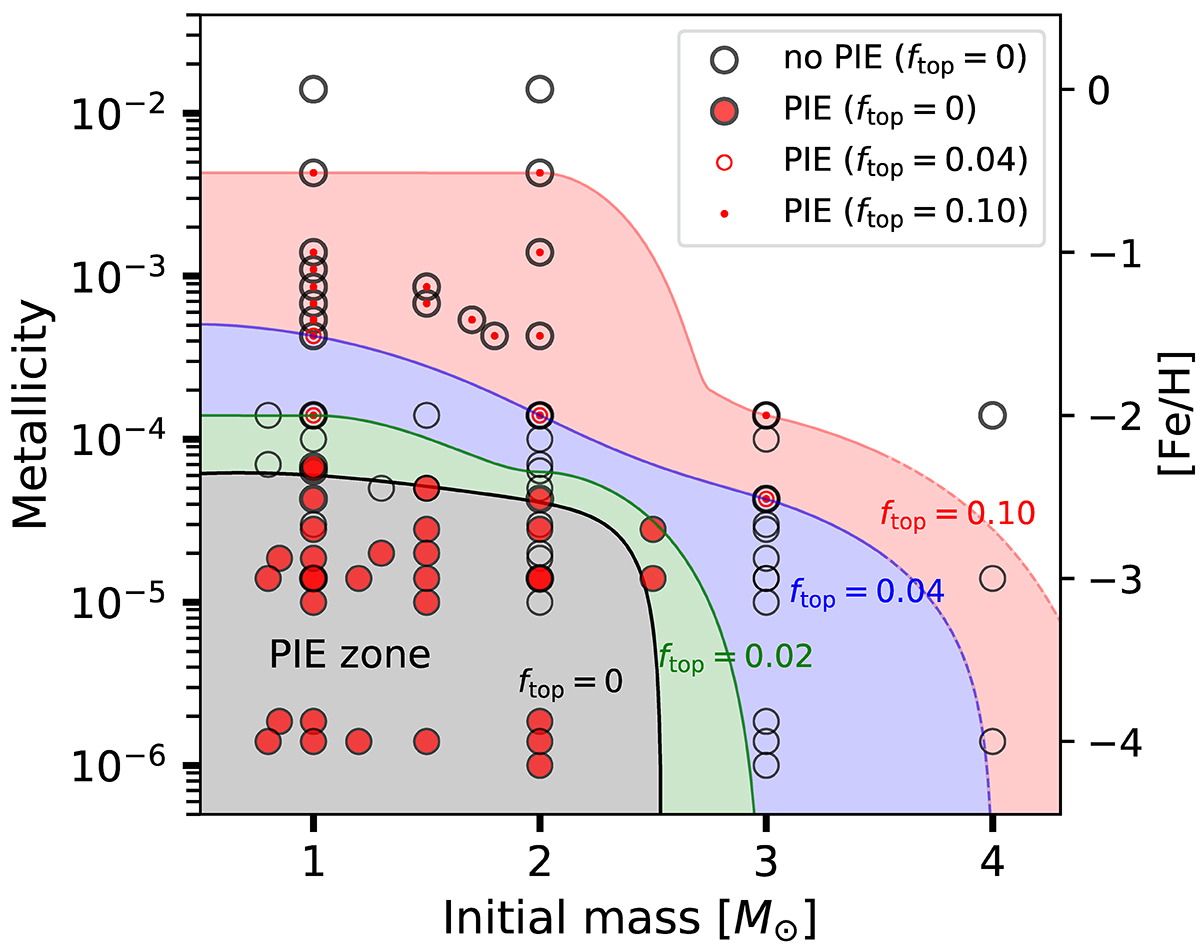
Fig. 12.
Download original image
Mass-metallicity diagram showing the occurrence of PIEs during the early AGB phase. The corresponding [Fe/H] ratios are indicated on the right axis assuming solar-scaled mixtures. Red filled circles show AGB models experiencing a PIE when ftop = 0. Empty black circles are for models that do not experience a PIE when ftop = 0. Thick black circles denotes models computed in this work and in Paper III. The small red circles and red dots highlight our models that experience a PIE when ftop = 0.04 and 0.10, respectively. The other models are from Iwamoto et al. (2004), Campbell & Lattanzio (2008), Cristallo et al. (2009a, 2016), Lau et al. (2009), Suda & Fujimoto (2010). The four colored zones show the approximate PIE zone when ftop = 0, 0.02, 0.04 and 0.10.
Current usage metrics show cumulative count of Article Views (full-text article views including HTML views, PDF and ePub downloads, according to the available data) and Abstracts Views on Vision4Press platform.
Data correspond to usage on the plateform after 2015. The current usage metrics is available 48-96 hours after online publication and is updated daily on week days.
Initial download of the metrics may take a while.