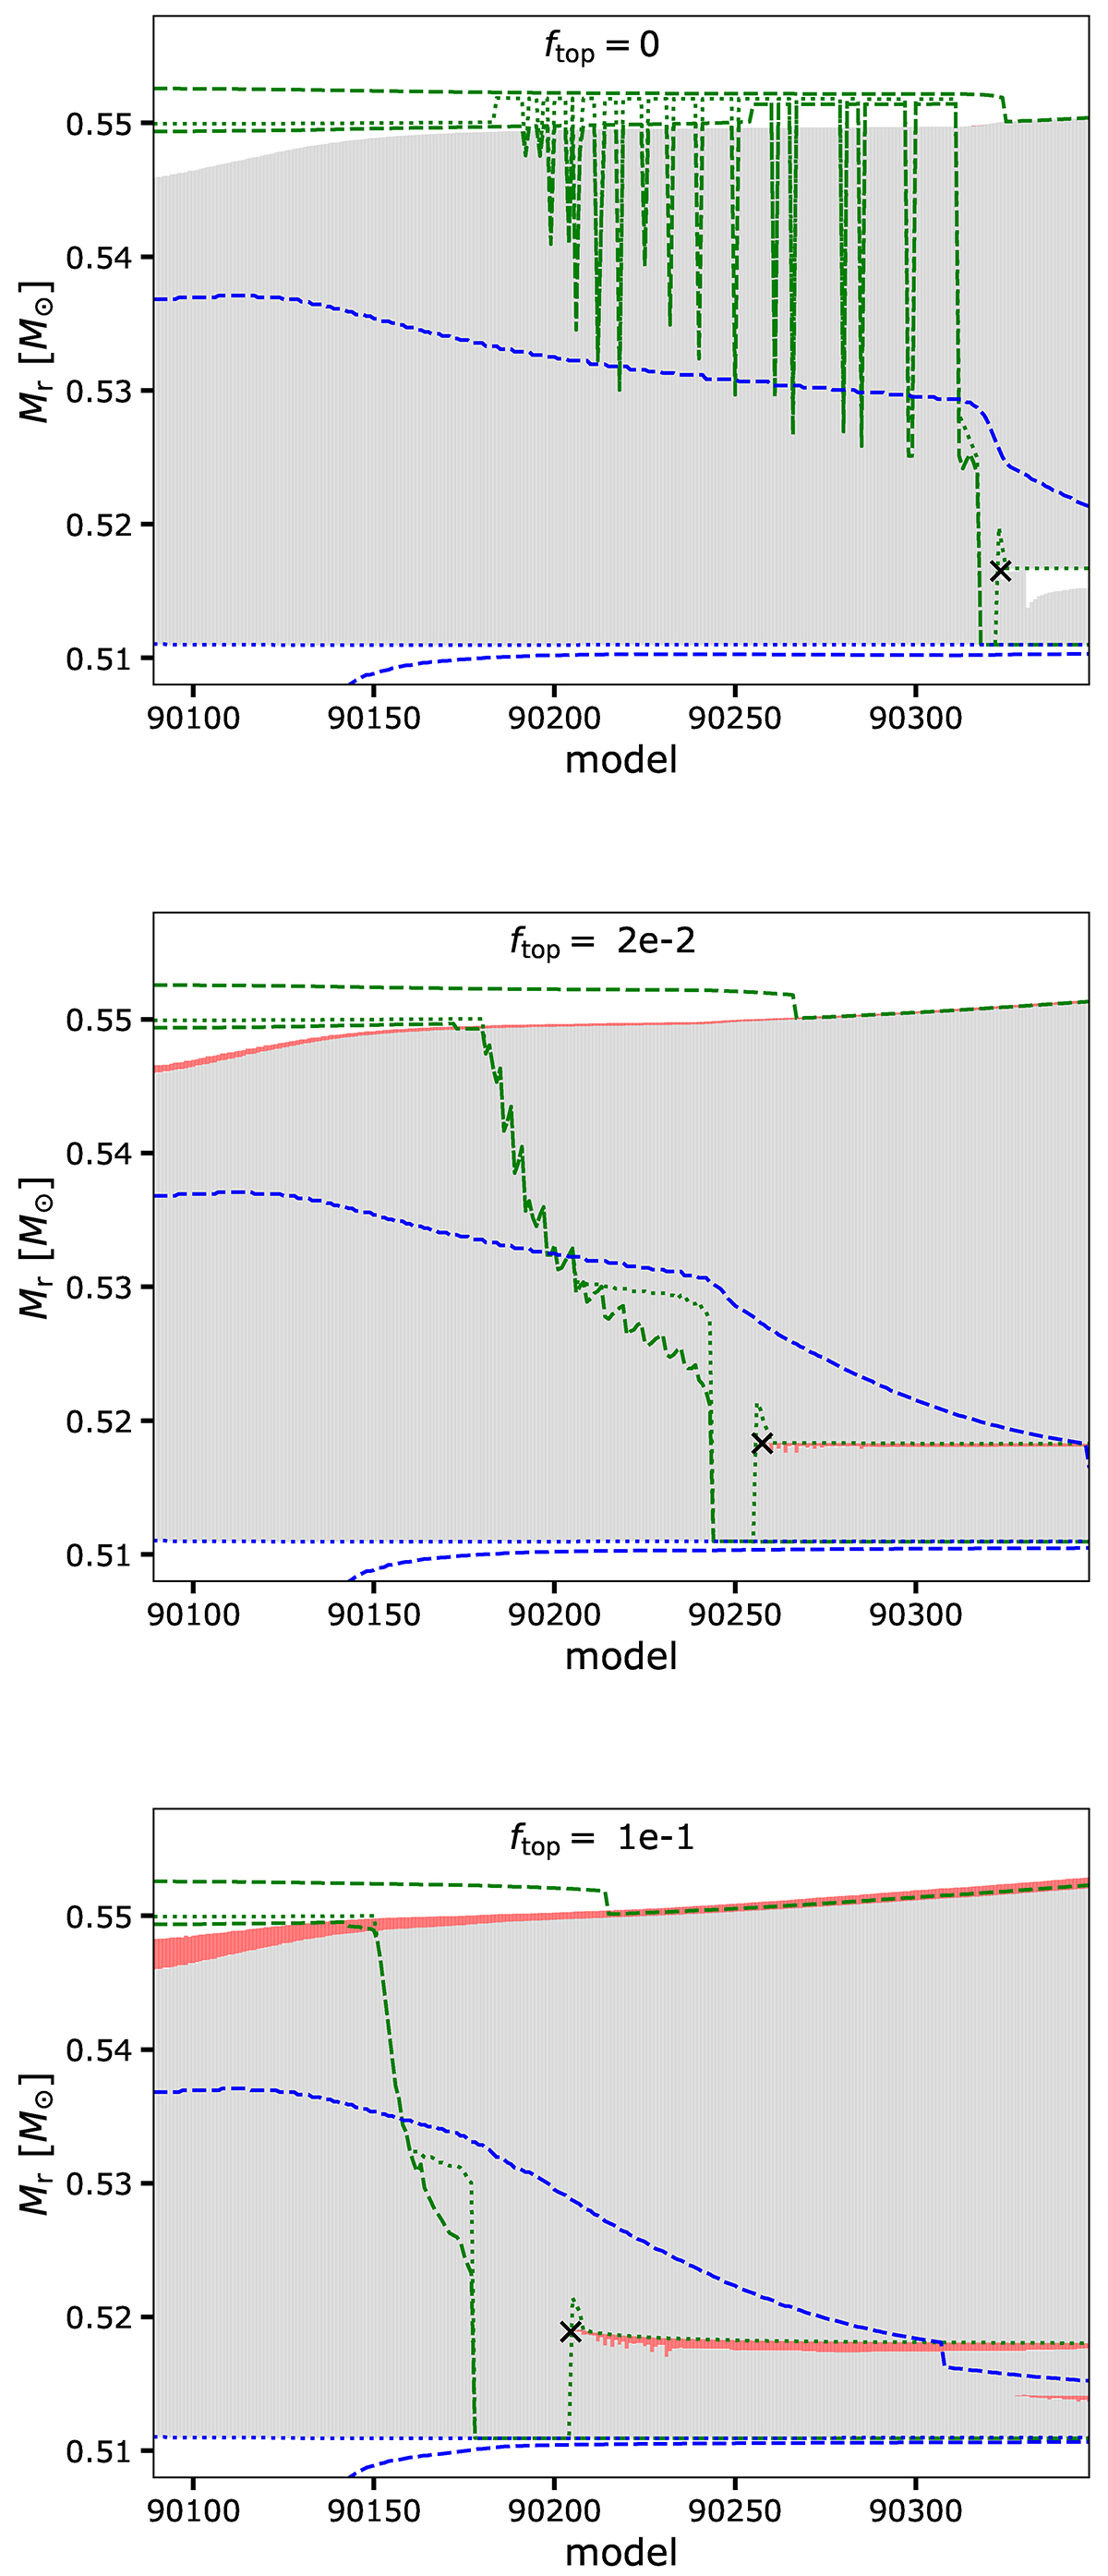
Fig. 1.
Download original image
Kippenhahn diagrams showing the PIE in a 1 M⊙, [Fe/H] = −2.5 AGB model for three different values of the overshoot coefficient at the top of the convective pulse (ftop). Convective regions are shaded gray. The dotted green and blue lines trace the mass coordinate where the nuclear energy production by hydrogen and helium burning is maximum, respectively. The dashed green and blue lines delineate the hydrogen and helium-burning zones (where the nuclear energy production by H and He burning exceeds 10 erg g−1 s−1). The red areas show the extent of the overshoot zones. The black crosses indicates where and when the convective pulse splits.
Current usage metrics show cumulative count of Article Views (full-text article views including HTML views, PDF and ePub downloads, according to the available data) and Abstracts Views on Vision4Press platform.
Data correspond to usage on the plateform after 2015. The current usage metrics is available 48-96 hours after online publication and is updated daily on week days.
Initial download of the metrics may take a while.