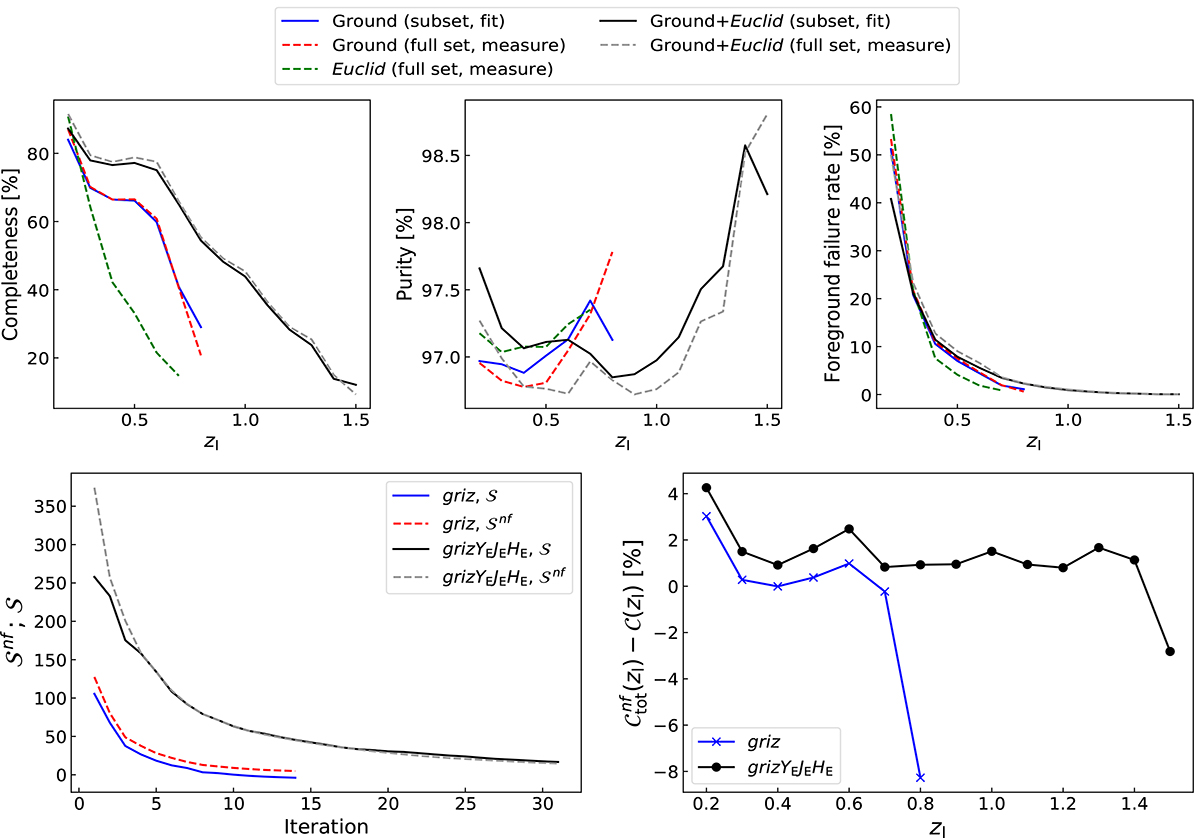
Fig. 5.
Download original image
Summary of the results on the colour selection optimisation, based on the B20 galaxy sample. Top panels: selection completeness (left panel), purity (central panel), and foreground failure rate (right panel), as a function of zl. The dashed lines represent the selections derived from the full sets of optimal conditions not fitted as a function of zl, in the case of ground-only (red), Euclid-only (green), and the combination of ground-based and Euclid bands (grey). The solid lines represent the selections obtained from the subsets of optimal conditions, with parameters fitted as a function of zl, in the case of ground-only (blue) and for the combination of ground-based and Euclid bands (black). Bottom panels: in the left panel, 𝒮 and 𝒮nf are shown as a function of the iteration number. For the ground-based selection, using griz filters, 𝒮 and 𝒮nf are represented by solid blue and dashed red lines, respectively. For the selection derived from the combination of ground-based and Euclid filters, namely grizYEJEHE, 𝒮 and 𝒮nf are represented by solid black and dashed grey lines, respectively. In the right panel, the difference between ![]() and 𝒞 is shown, for the griz (blue lines) and grizYEJEHE (black lines) selections.
and 𝒞 is shown, for the griz (blue lines) and grizYEJEHE (black lines) selections.
Current usage metrics show cumulative count of Article Views (full-text article views including HTML views, PDF and ePub downloads, according to the available data) and Abstracts Views on Vision4Press platform.
Data correspond to usage on the plateform after 2015. The current usage metrics is available 48-96 hours after online publication and is updated daily on week days.
Initial download of the metrics may take a while.