Fig. 12.
Download original image
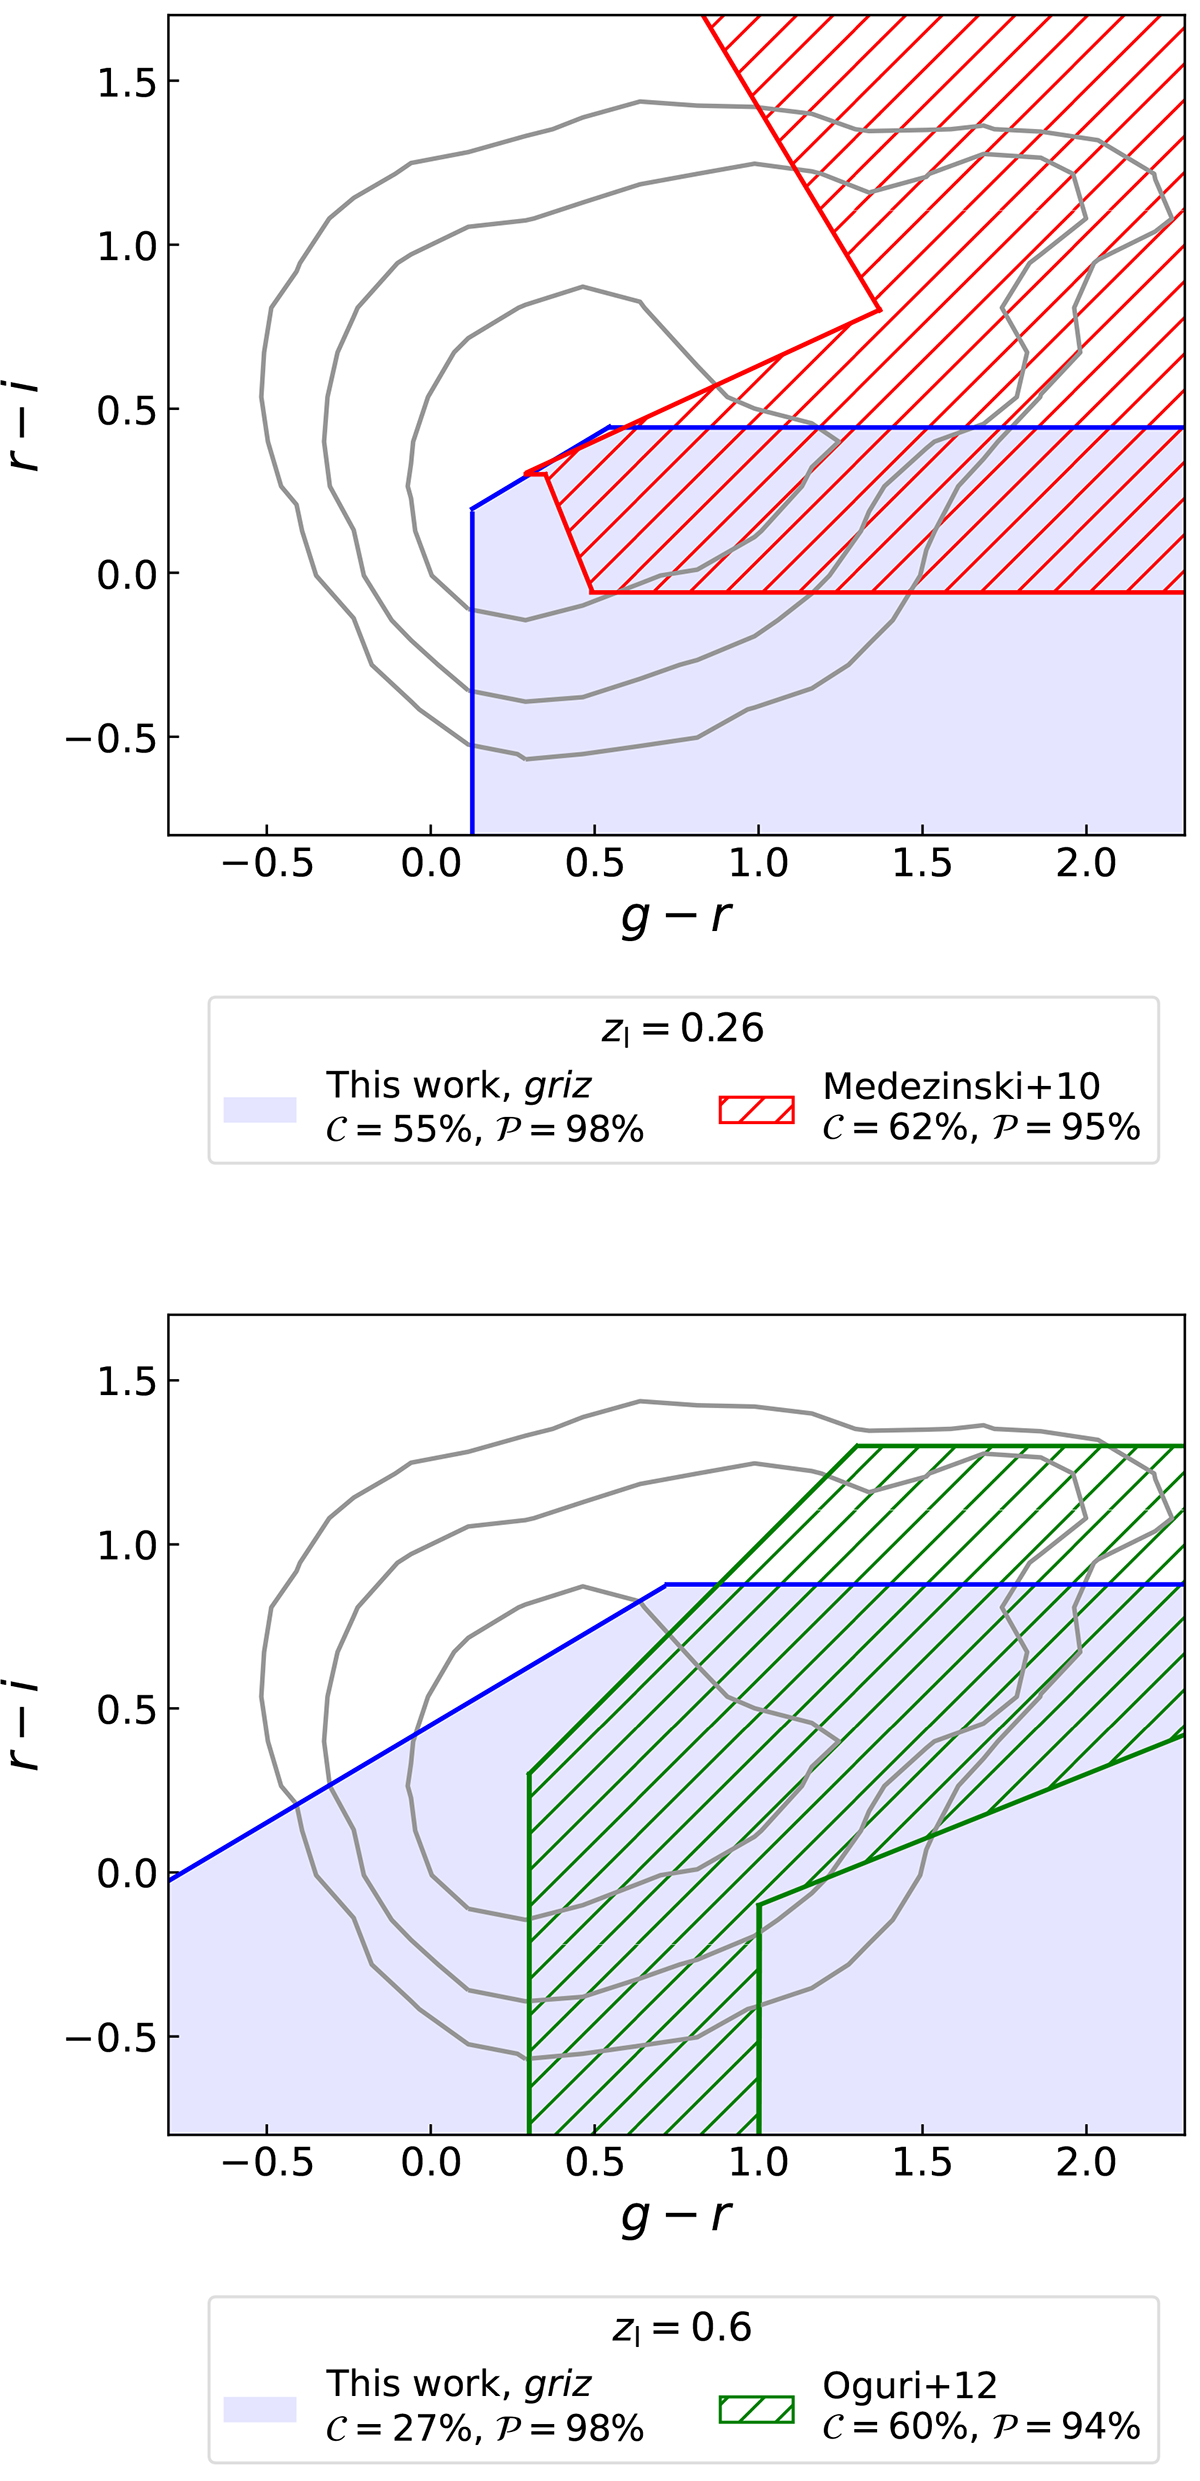
Comparison of colour selections in the (r − i)−(g − r) colour-colour space. The solid grey contours indicate the 68%, 95%, and 99% galaxy number density in the calibration sample, described in Sect. 2. The blue shaded areas represent the regions excluded by applying the griz selection calibrated in Sect. 4.1. Completeness and purity of the selections are reported in the legends. For the griz selection, 𝒞 and 𝒫 are computed by considering the colour conditions in Table A.1 which are defined in the (r − i)−(g − r) space. Top panel: the red hatched area shows the region excluded through the Medezinski et al. (2010) selection, and zl = 0.26 is assumed. Bottom panel: the green hatched area shows the region excluded through the Oguri et al. (2012) selection, and zl = 0.6 is assumed.
Current usage metrics show cumulative count of Article Views (full-text article views including HTML views, PDF and ePub downloads, according to the available data) and Abstracts Views on Vision4Press platform.
Data correspond to usage on the plateform after 2015. The current usage metrics is available 48-96 hours after online publication and is updated daily on week days.
Initial download of the metrics may take a while.