Fig. 9.
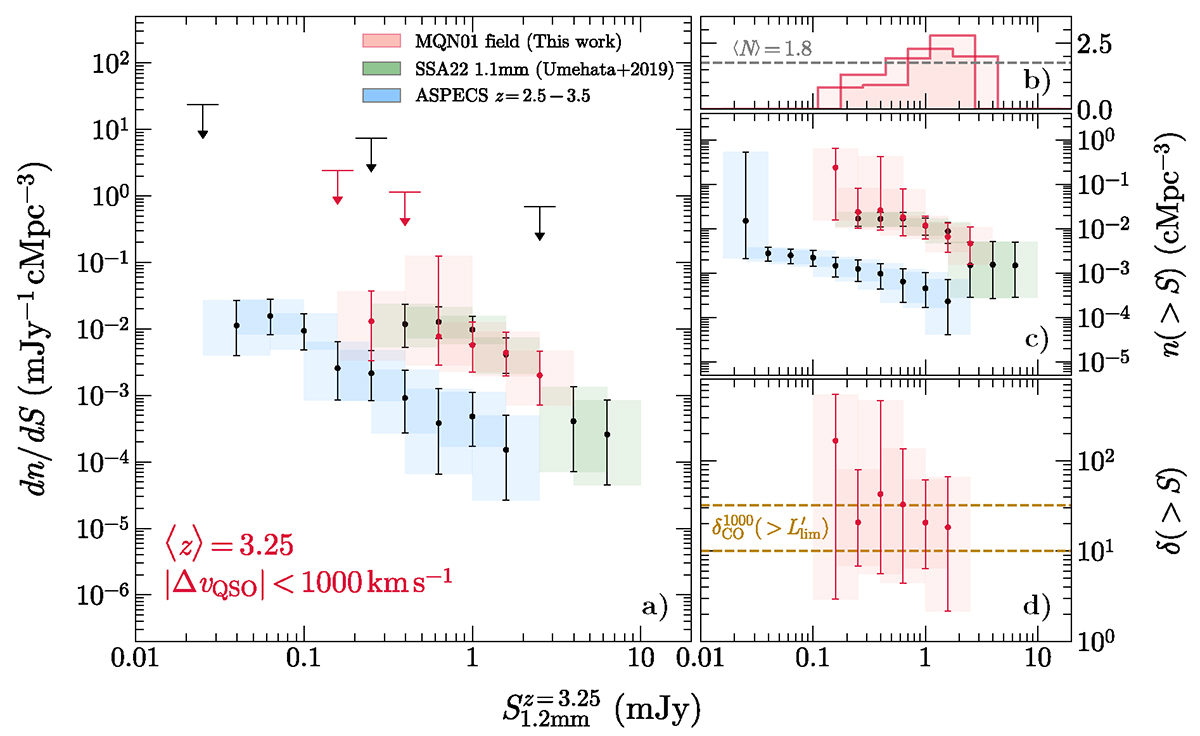
Download original image
Overdensity of dusty star-forming galaxies in the MQN01. Panel a: differential 1.2 mm continuum source number count density in MQN01 (red points and boxes; including galaxies within |ΔvQSO|< 1000 km s−1), SSA22 (black dots and green boxes; Umehata et al. 2017, 2019 within ±1000 km s−1 of the median source redshift), and in blank fields as derived from ASPECS large program (black points and blue boxes; Aravena et al. 2019, 2020; Boogaard et al. 2019, 2020; González-López et al. 2019, 2020) including sources with spectroscopic redshift between 2.5 ≤ z ≤ 3.5. The downward arrows indicate 1σ upper limits. Panel b: number of sources in each luminosity bin averaged over the iterations. The horizontal gray line reports the total average number of sources entering each bin for the computation of the differential number counts. Panel c: cumulative source number density as a function of 1.2 mm continuum flux obtained by integrating the differential number count density. Panel d: cumulative source overdensity in MQN01 as a function of S1.2 mm. The horizontal lines represent the overdensity range of CO(4–3) emitters in ΔV1000.
Current usage metrics show cumulative count of Article Views (full-text article views including HTML views, PDF and ePub downloads, according to the available data) and Abstracts Views on Vision4Press platform.
Data correspond to usage on the plateform after 2015. The current usage metrics is available 48-96 hours after online publication and is updated daily on week days.
Initial download of the metrics may take a while.