Fig. 8.
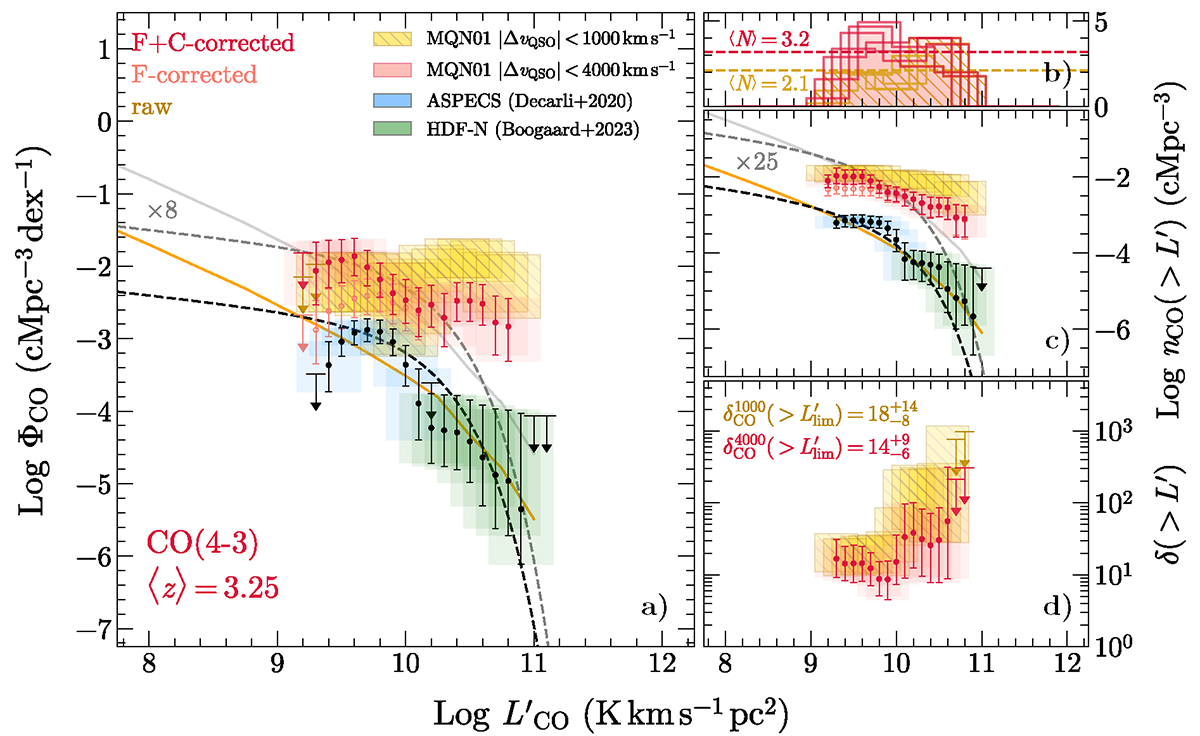
Download original image
Overdensity of CO emitters in the MQN01 field. Panel a: CO(4–3) LF in MQN01 and in blank fields. The (dark/light) red dots and boxes represent the CO LF in MQN01 field (fidelity (F) + completeness (C)-corrected/uncorrected, respectively) in ΔV4000, while gold hatched boxes are the uncorrected (raw) CO LF within ΔV1000. The blue and green boxes with black dots are data from ASPECS and HDF-N, respectively, which are representative of blank fields at these redshifts (e.g., Decarli et al. 2019, 2020; Boogaard et al. 2023). The downward arrows indicate 1σ upper limits. The dashed black line is the best-fit Schechter function to the ASPECS+HDF-N data reported in Boogaard et al. (2023). The orange line is the CO(4–3) LF prediction from SIDES simulation (Béthermin et al. 2022; Gkogkou et al. 2023) at z = 3 − 3.25. Gray lines represent the rescaled versions of such models. Panel b: Number of sources in each luminosity bin averaged over the iterations. The horizontal dashed line reports the total average number of sources entering each bin of the LFs. Panel c: Cumulative source number density as a function of the CO(4–3) line luminosity obtained by integrating the CO LFs. Panel d: Source overdensity in MQN01 field as a function of the CO(4–3) line luminosity obtained by a bin-to-bin ratio of the cumulative source number densities.
Current usage metrics show cumulative count of Article Views (full-text article views including HTML views, PDF and ePub downloads, according to the available data) and Abstracts Views on Vision4Press platform.
Data correspond to usage on the plateform after 2015. The current usage metrics is available 48-96 hours after online publication and is updated daily on week days.
Initial download of the metrics may take a while.