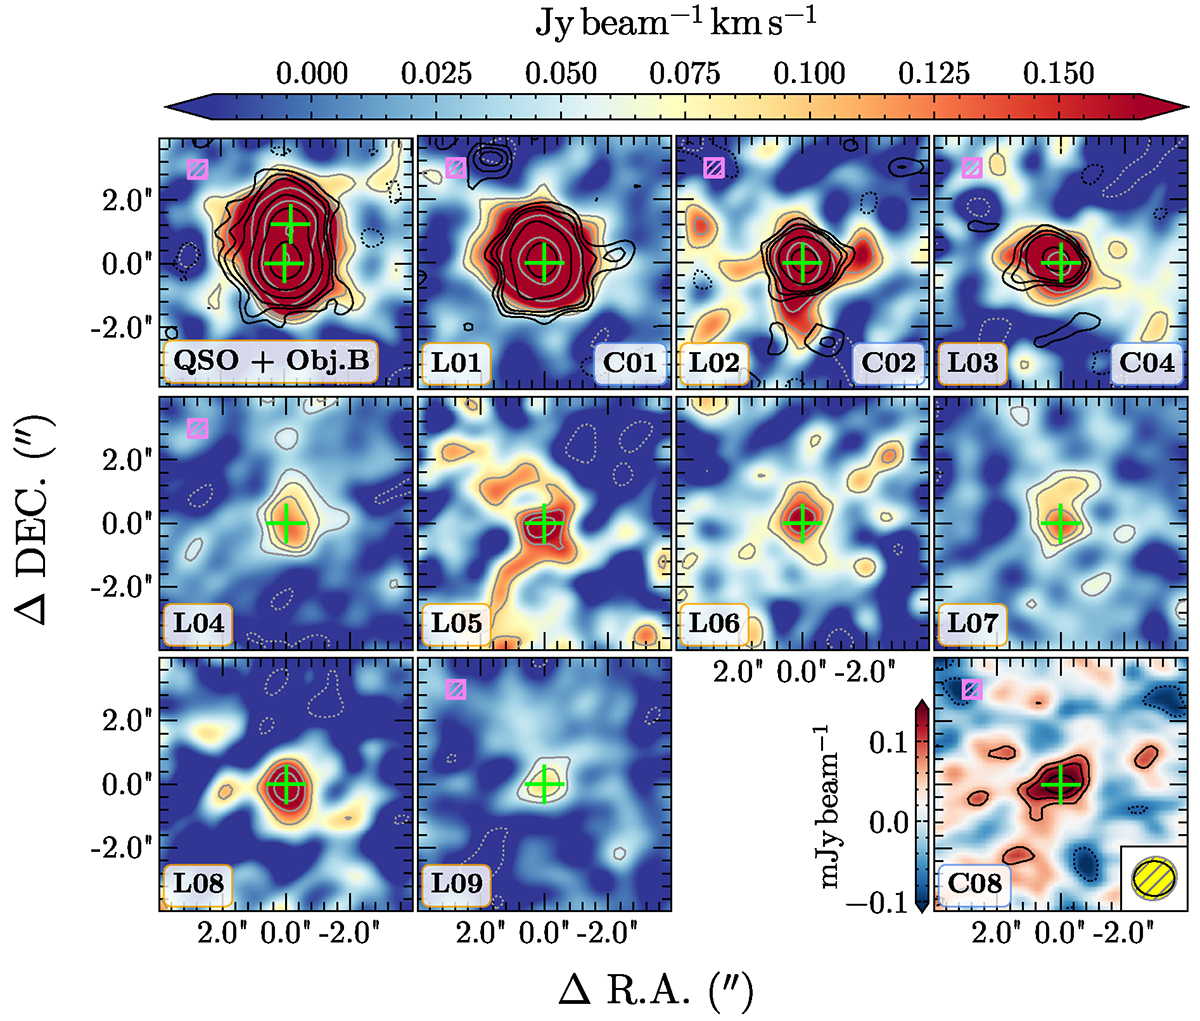
Fig. 7.
Download original image
Maps of the ALMA-selected galaxies in the MQN01 field detected in their CO(4–3) line, in the continuum at 1.2 mm, or in both. The color scale at the top refers to line-velocity integrated maps for all sources except C08, which is only detected at 1.2 mm in the dust continuum (bottom right color scale). Solid gray and black contours correspond to the velocity-integrated and 1.2 mm dust continuum maps, respectively and scales as [2, 3, 2N]×σ with N > 1 integer number. Dotted contours are the −2σ level. The yellow ellipse drawn in the bottom right corner represents the FWHM of the synthesized beam of the ALMA band 3 (yellow fill and gray line) and 6 (black line) observations. Sources are labeled according to the IDCO and/or ID1.2 mm reported in Table 3. Sources with spectroscopic-redshift confirmation are marked with a violet square in the upper-left corner.
Current usage metrics show cumulative count of Article Views (full-text article views including HTML views, PDF and ePub downloads, according to the available data) and Abstracts Views on Vision4Press platform.
Data correspond to usage on the plateform after 2015. The current usage metrics is available 48-96 hours after online publication and is updated daily on week days.
Initial download of the metrics may take a while.