Fig. 6.
Download original image
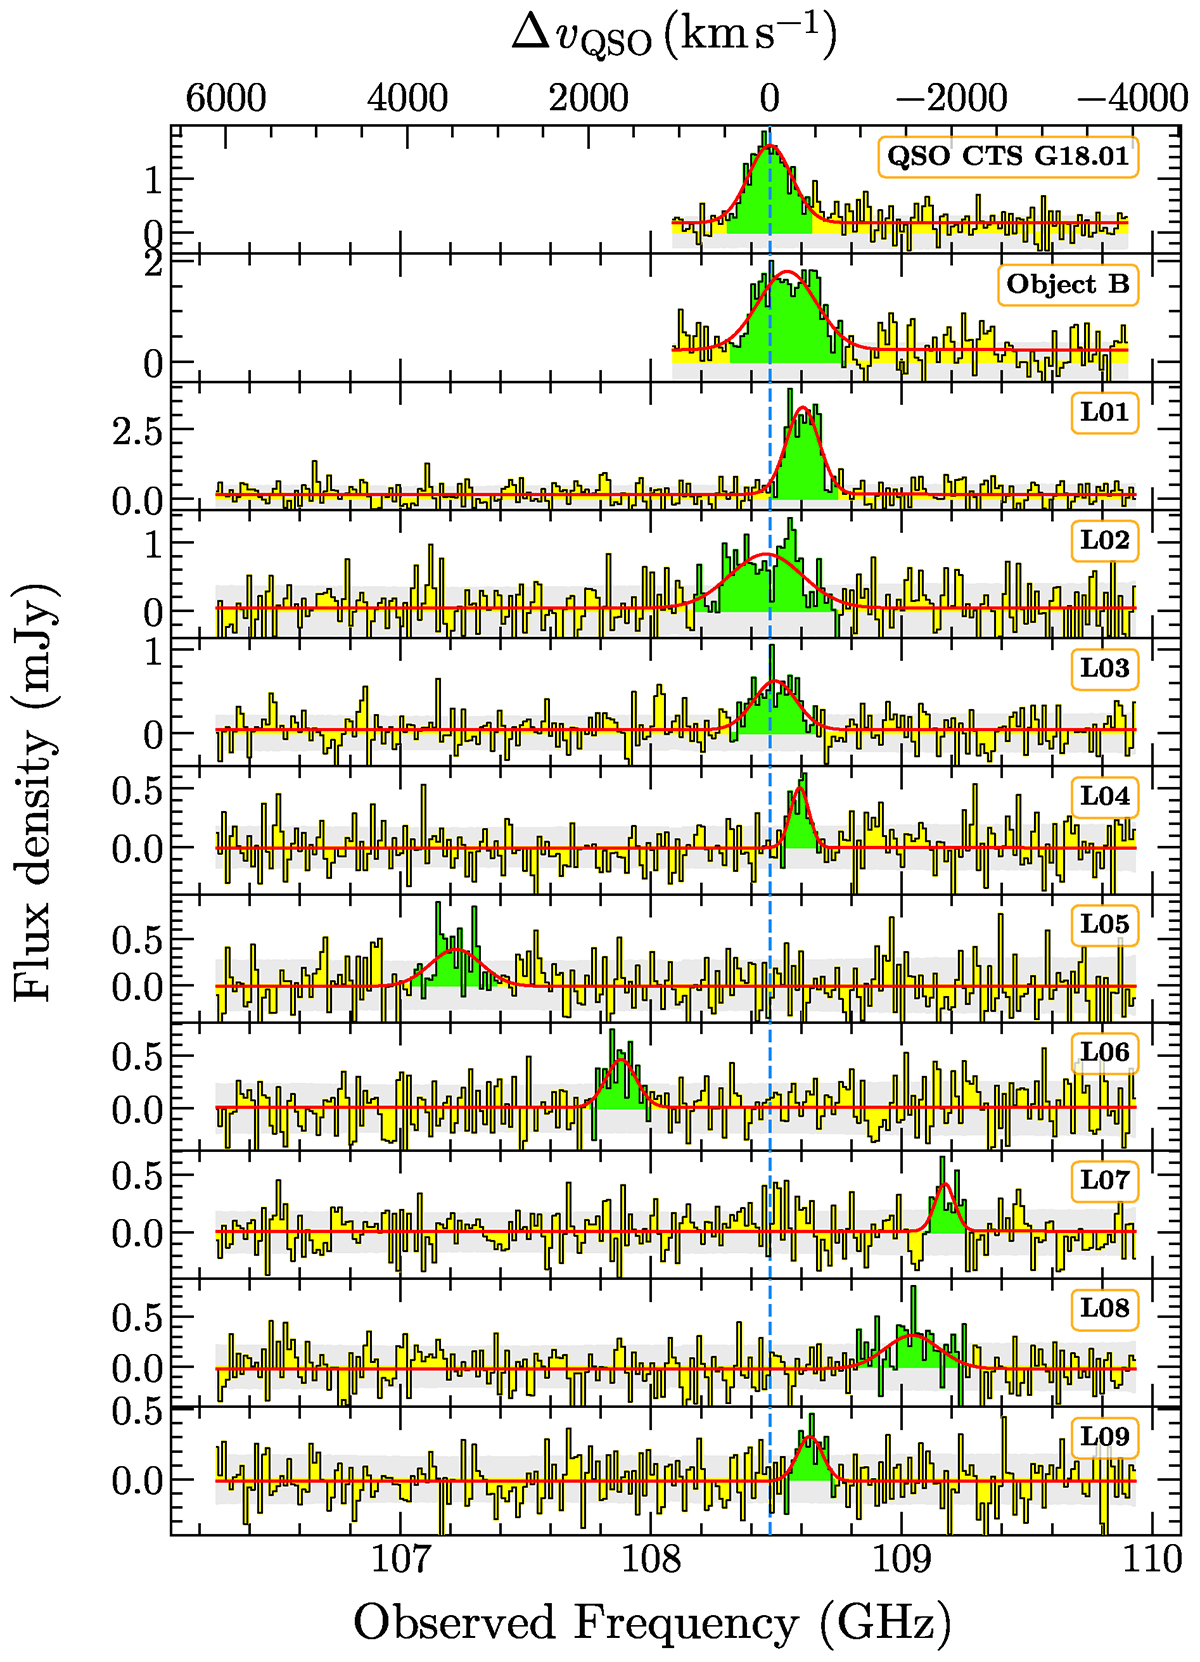
Spectra of the CO(4–3) line-emitting sources in our ALMA survey of the MQN01 field. The red lines are the best-fit models to the spectra (yellow bins). The green bins indicate the channels we used to compute the line-velocity integrated maps (see Fig. 7) defined within ±2σ of the best-fitting Gaussian line. The horizontal gray bands are the rms noise in each channel. The blue vertical line indicate the QSO CTS G18.01 systemic velocity. Sources are labeled according to the IDCO reported in Table 3.
Current usage metrics show cumulative count of Article Views (full-text article views including HTML views, PDF and ePub downloads, according to the available data) and Abstracts Views on Vision4Press platform.
Data correspond to usage on the plateform after 2015. The current usage metrics is available 48-96 hours after online publication and is updated daily on week days.
Initial download of the metrics may take a while.